
Field Notes
<--2023-04-26 14:30:00 | 2023-05-30 11:30:00-->Other sites visited today: Tonzi
Phenocam link: Searching...
Vaira: 2023-05-16 10:50:00 (DOY 136)
Author: Joe Verfaillie
Others:
Summary: Hot. Standard data collection, updated met program for Bowen ratio stats
| Vaira 2023-05-16 I arrived at about 10:50 PDT. It was clear sunny and hot. The ground surface is dry but the water hole is still nearly full. Flowers are blooming everywhere and the grass is about knee to mid-thigh high and going to seed. The trees have full, dark green leaves. I measured the well and then collected the met, flux, FD and camera data. All seemed well. I cleaned spider webs off the 7500 The 7500 read: 437.3ppm CO2, 607.8mmol/m3 H2O, 29.3C, 99.6kPa, 101.0SS I updated the CR1000 met program. I added another table, “revbow” to add the statistics that Carlos’s method for calculating LE as a residual needs. This code does the calculation with and without the pressure from the Vaisala that can be funky at times. I took spectra and veg heights. A lot of the grasses are at the height of the electric fence wire and there is plenty for the cows to eat outside the fence, so I left the fence charger off. I left at about 12:00 noon PDT |
Field Data
No tank data
Well Depth
| Date | Location | Depth (feet) |
|---|---|---|
| 2023-05-16 | VR_well | 48.15 |
| 2023-05-16 | TZ_floor | 15.1 |
| 2023-05-16 | TZ_road | 24.35 |
| 2023-05-16 | TZ_tower | 19.2 |
No TZ Moisture Point data found
No VR Moisture Point data found
No TZ grass heigth found
Grass Height VR 14
| Date | Height reps (cm) | Location | Average | Samp | STDEV | |||||||||||||
|---|---|---|---|---|---|---|---|---|---|---|---|---|---|---|---|---|---|---|
| 2023-05-16 | 37 | 70 | 65 | 50 | 40 | 50 | 80 | 30 | 35 | 25 | 60 | 35 | 70 | 45 | GH_ALL | 49.43 | 14 | 16.45 |
No VR Tree DBH found
No water potential data found
No VR Grass Biomass data found
No VR OakLeaves Biomass data found
No VR PineNeedles Biomass data found
1 photos found
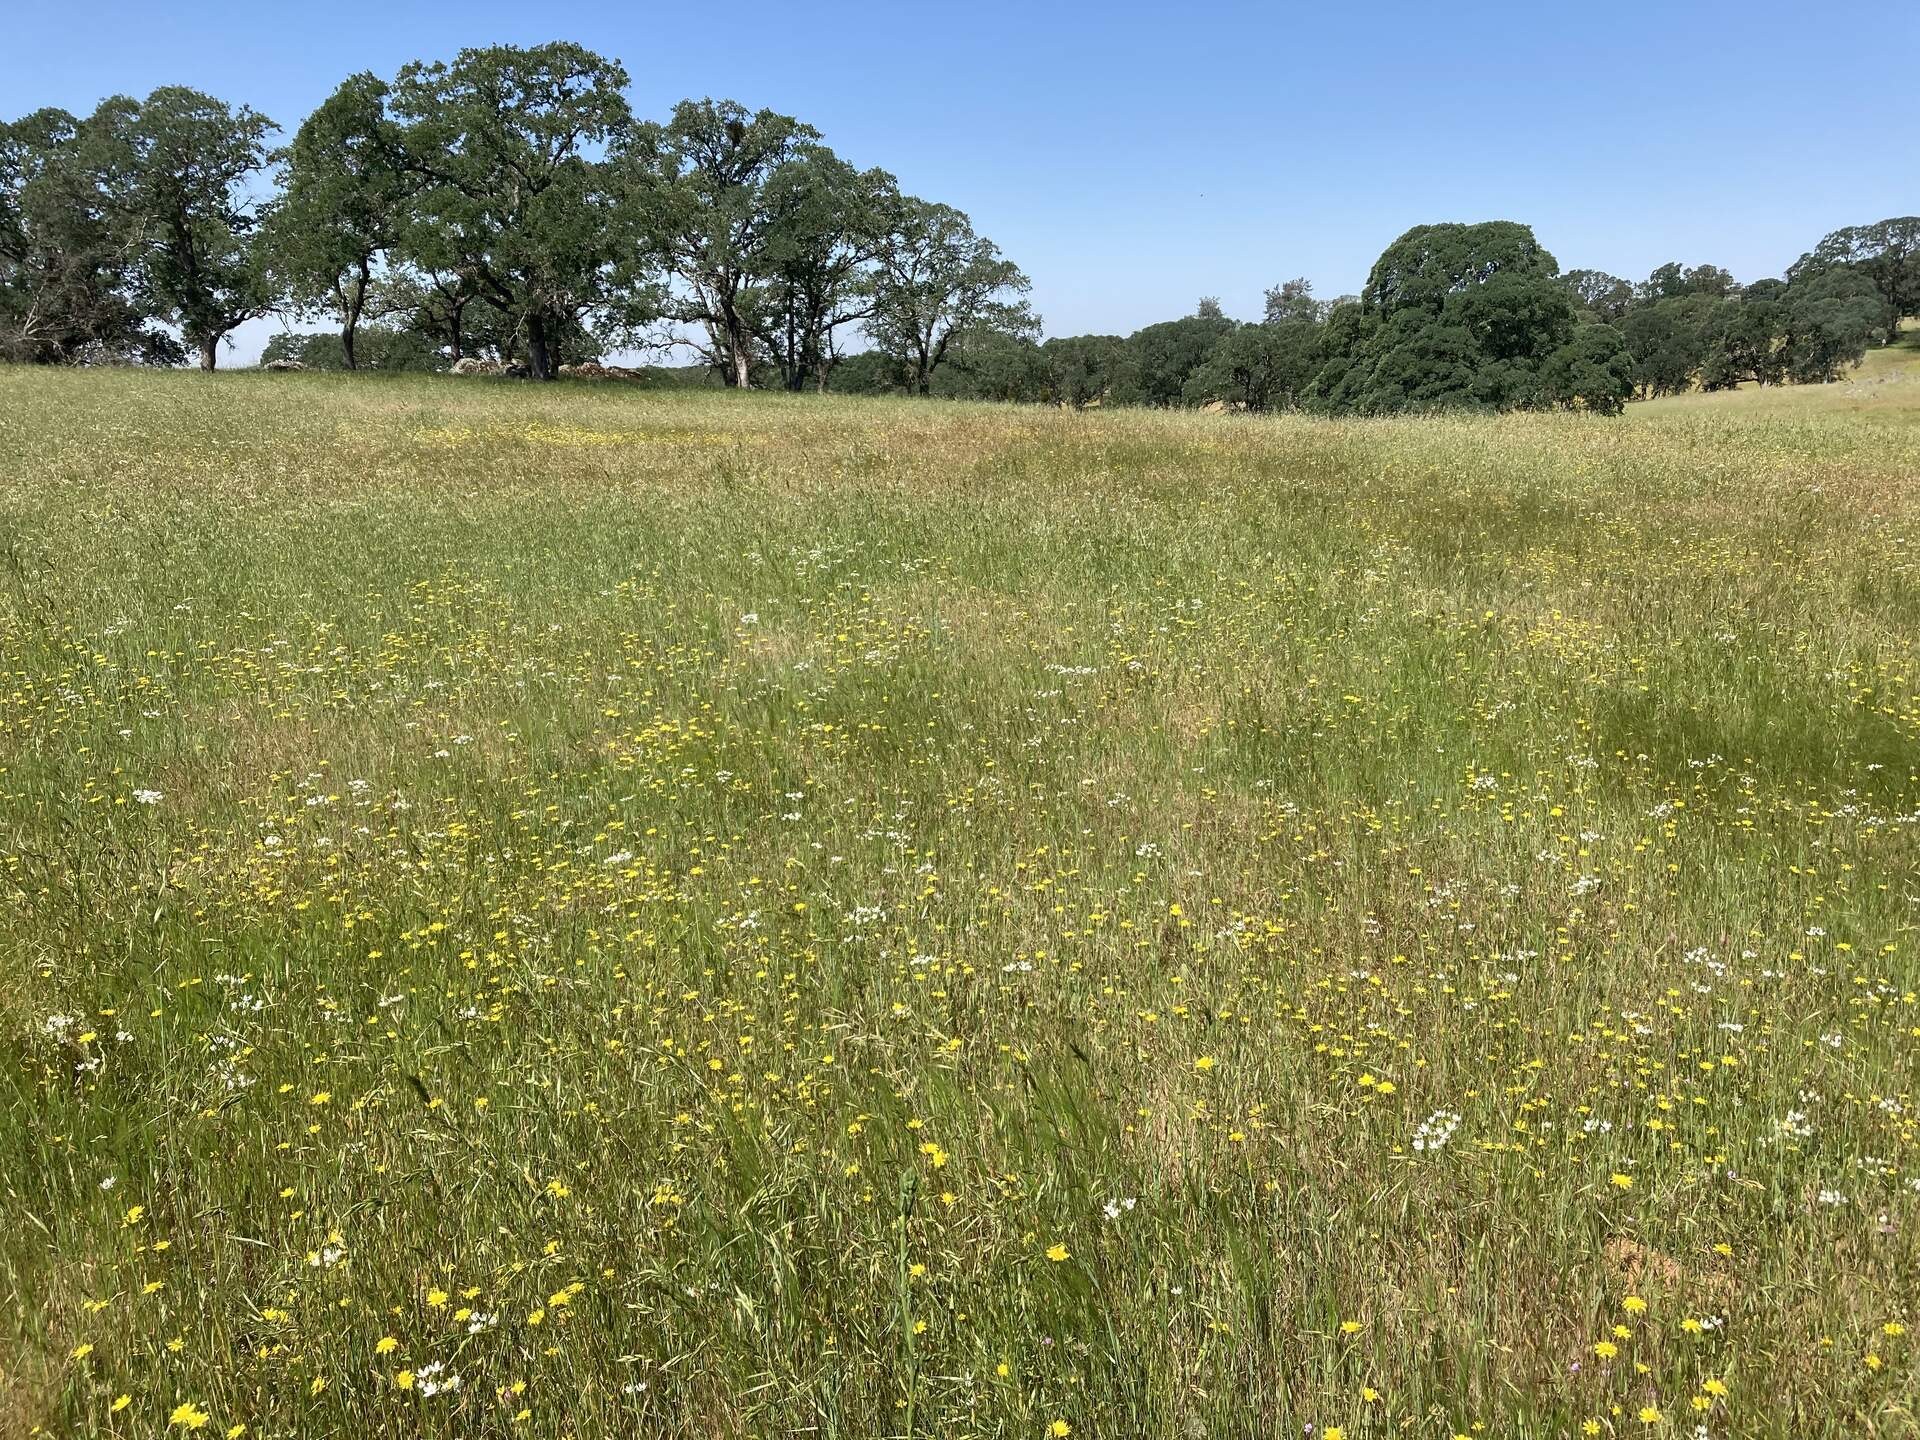
20230516VR_LotsOfFlowers.jpg ( 2023-05-16 10:59:49 ) Full size: 1920x1440
Many different flowers are all blooming
9 sets found
16 VR_met graphs found
2 VR_flux graphs found
No data found for VR_soilco2.
2 VR_pond graphs found
Can't check TZVR_mixed
3 VR_fd graphs found
4 VR_processed graphs found
4 VR_arable graphs found
6 VR_soilvue graphs found