
Field Notes
<--2022-11-18 13:35:00 | 2022-12-13 14:40:00-->Other sites visited today: Hill Slough | Bouldin Alfalfa
Phenocam link: Searching...
Bouldin Corn: 2022-11-30 12:45:00 (DOY 334)
Author: Daphne Szutu
Others: Joe
Summary: Regular data collection/cleaning, neighboring fields planted with wheat, soil sensors still under tower, calibrated 7700, swapped 7500 for calibration, restarted Mark 3 and removed a Mark II
| 2022-11-30 Bouldin Corn Joe and I arrived at 12:45 PST. It was sunny and getting breezier, with some thin clouds overhead and thicker clouds near the horizon. Our field looks the same as the two weeks ago: the corn stubble has been knocked down and the organic matter is still covering the field’s surface. This is in contrast to our neighboring fields, where the agricultural residue has been incorporated into the soil. The fields to our south have been planted with wheat, which is about 5-10cm tall. More fields around probably have wheat as well, but they just have not sprouted yet. I wonder how many fields will be flooded this winter, and if the duck club is still planning on hunting this season. We had planned to move the soil sensors back into the field today, but we’re not sure if there is more tractor work coming. The Silver Lab chambers are not in the field yet either, so we decided to wait on moving the soil sensors out into the field. We calibrated the LI-7700 sn TG1-0211 as part of its routine maintenance. There was some breeze but it wasn’t too bad. The calibration offsets were both small. The optics RH was 23%, so we also flushed the headspace with zero after calibration and swapped in fresh desiccant. The thermocouple assembly was missing part of its protective tubing, so Joe used pliers to remove the spare tubing from the o-ring-less thermocouple from HS and put it on the thermocouple here. The 7700 hat and spray head were placed back on the 7700 after the calibration. I downloaded all the usual data, met, cam, USB GHG, FD, PA, and IRT. We swapped the 7500 for calibration: sn 75H-2180 came off and sn 1594 went on. I uploaded a new config file, updated the pressure coefficients, and we reset the box after we finished the 7700 calibration. All looked well. Joe cleaned flux sensors but we forgot to clean the radiometers. He also checked the precip bucket and cleaned bird poop and a decapitated small (smol) mouse out of it. Joe restarted the Mark 3, which did not seem to boot after installation at the last site visit. He also removed one Mark II sn C003251 and restarted the other Mark II sn C006123. We now have one Mark II and one Mark 3 on this tower. He confirmed with Loreli that both were online. 2180 dirty read: 424ppm CO2, 322mmol/m3 H2O, 14.7C, 101.4kPa, 97SS 2180 clean read: 430ppm CO2,306mmol/m3 H2O, 15.9C, 101.3kPa, 100SS 1594 fresh read: 443ppm CO2, 260mmol/m3 H2O, 17.7C, 101.3kPa, 100SS TG1-0357 dirty read: 2.39ppm CH4, 50RSSI TG1-0357 clean read: 2.38ppm CH4, 81RSSI TG1-0357 after cal read: 2.24ppm CH4, 76RSSI We left at 13:50 PST. Looking at the data back in the lab, the PA file had some extraneous characters at the end of the header line. I used Joe's clean.bat to get ride of them. |
2 photos found

bouldincorn_2022_11_30_084506.jpg ( 2022-11-30 08:46:48 ) Full size: 1296x960
Kestrel? on radiometers
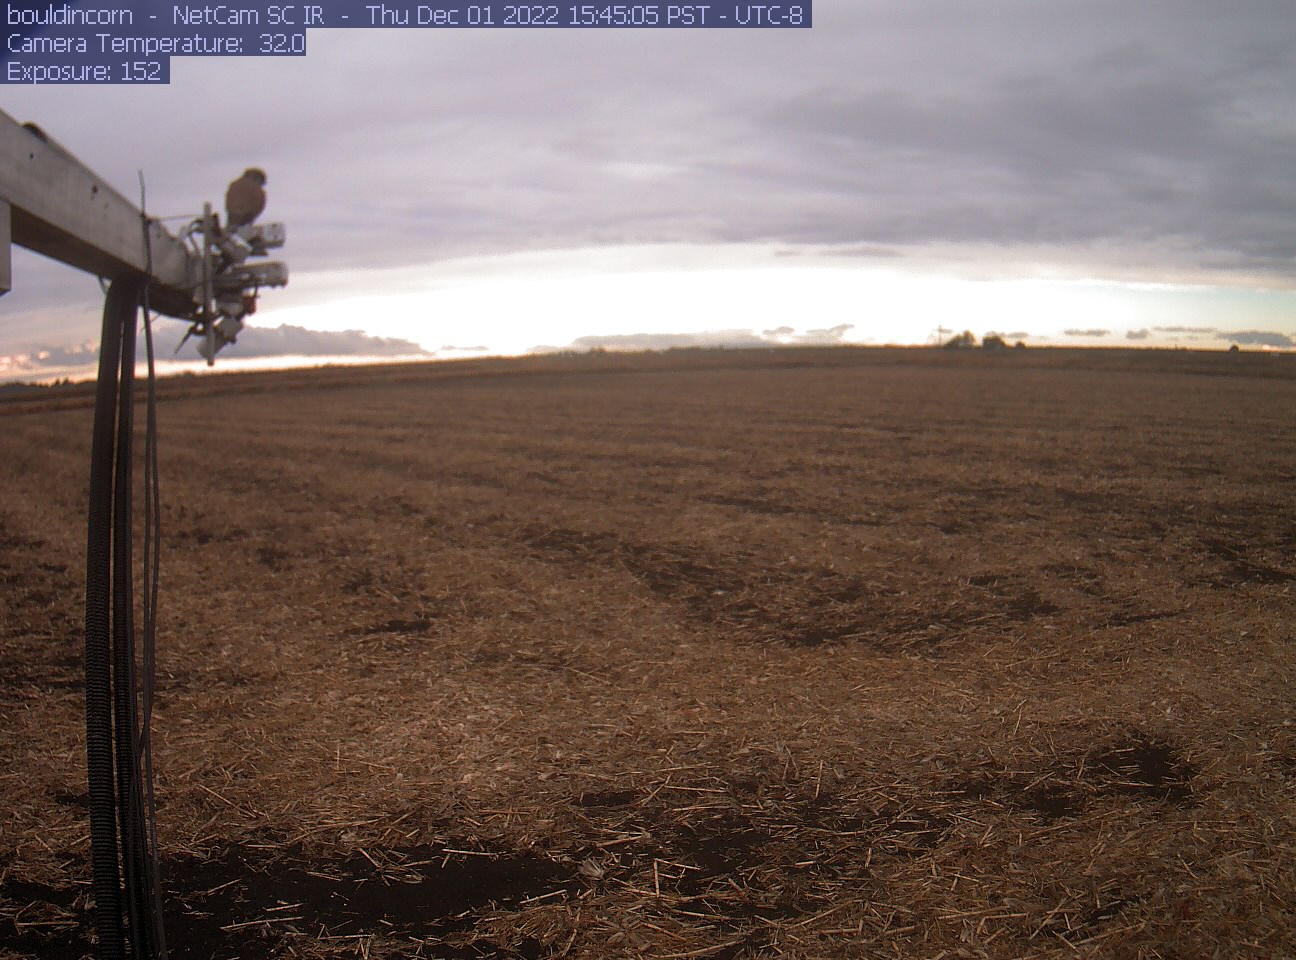
bouldincorn_2022_12_01_154505.jpg ( 2022-12-01 23:46:20 ) Full size: 1296x960
Kestral on the radiometers
6 sets found
17 BC_met graphs found
5 BC_flux graphs found
Can't check TATWBABCSB_cam
Can't check MBSWEEWPBCBA
2 BC_pa graphs found
1 BC_arable graphs found