Field Notes
<--2022-11-02 16:00:00 | 2022-11-30 12:45:00-->Other sites visited today: Gilbert Tract | Mayberry | Sherman Wetland | West Pond | East End | Bouldin Alfalfa
Phenocam link: Searching...
Bouldin Corn: 2022-11-18 13:35:00 (DOY 322)
Author: Daphne Szutu
Others: Ari
Summary: Regular data collection/cleaning, field has been disked but more tractor work expected, swapped out prototype Mark 3 for production Mark 3, windy
| 2022-11-18 Bouldin Corn Ari and I arrived at 13:35 PST. There was a strong wind from the north and it was sunny and cool. Our field has been tilled/disked but there is still a lot of organic matter on the surface compared to neighboring fields. Neighboring fields have mostly bare soil at the surface. There may be more tractor work to come here. Many strings of birds flying overhead. I downloaded met, cam, USB GHG, FD, PA, and IRT data. There were about four days Nov. 6-10 where FD flux was 0, but it seems ok now. I changed the eddy clock +45sec around 13:57 PST and restarted logging. I changed the water level desiccant. Ari cleaned flux and rad sensors. The reservoir was 90% full; we refilled it. Ari swapped out the prototype Mark 3 for a production Mark 3 sn B301069. We turned on the sensor by pressing the power button for 2sec and saw the various status lights blink. It’s in the same orientation as before, where the solar panel faces east and the sensors face west toward the field. The 7500 read: 418ppm CO2, 260mmol/m3 H2O, 19.8C, 101.6kPa, 99SS -- 100 after cleaning The 7700 read: 2.0ppm CH4, 55RSSI – 75 after cleaning We left at 14:05 PST. |
2 photos found

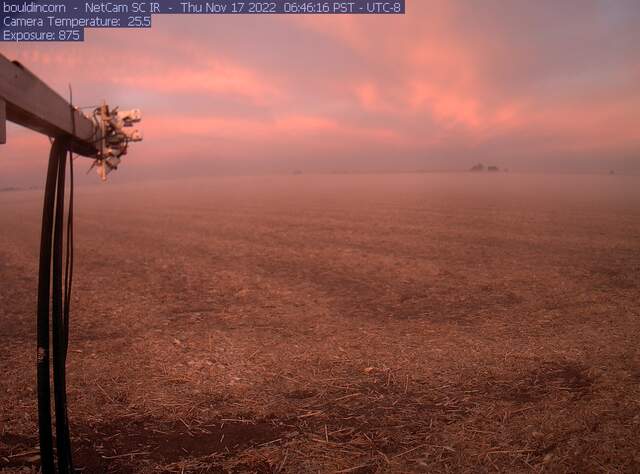
bouldincorn_2022_11_17_064506.jpg ( 2022-11-17 06:46:42 ) Full size: 1296x960
Pretty sunrise with tule fog

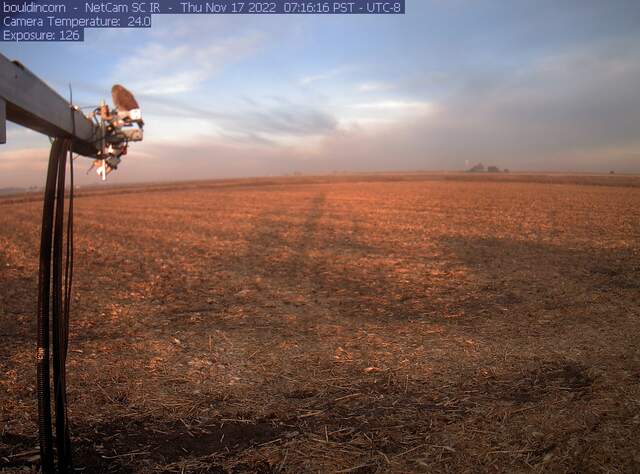
bouldincorn_2022_11_17_071506.jpg ( 2022-11-17 07:16:44 ) Full size: 1296x960
Kestrel? on radiometer
6 sets found
17 BC_met graphs found
5 BC_flux graphs found
Can't check TATWBABCSB_cam
Can't check MBSWEEWPBCBA
2 BC_pa graphs found
1 BC_arable graphs found

