Field Notes
<--2022-11-08 07:15:00 | 2022-12-13 09:50:00-->Other sites visited today: Mayberry | Sherman Wetland | West Pond | East End | Bouldin Corn | Bouldin Alfalfa
Phenocam link: Searching...
Gilbert Tract: 2022-11-18 08:45:00 (DOY 322)
Author: Daphne Szutu
Others: Ari
Summary: Regular data collection/cleaning, nice fall day, added copper tape to miniDOT cap
| 2022-11-18 Gilbert Tract Ari and I arrived at the channel at 8:45 PST. It was a sunny and crisp fall morning. The water level was middling and the tide was coming in. Ari had planned to get in the water to removed weeds from around Flo (our flowmeter), but she put one foot in the waders and realized the boots were still wet from last week’s tidal sampling campaign so we decided we could skip the weed control today. We should figure out how to store our waders upside down. We downloaded data from the flowmeter, reset its clock to match the laptop time, and restart logging. Not too many data drops this time. We arrived at the tower around 9:00 PST. The staff gauge read 18cm at 9:05 PST. I downloaded met, cam, and USB GHG data. There were 4 weeks of photos on the card because I forgot both an extra card and the card reader during the previous visit. The eddy clock was 10sec ahead so I did not change it. Ari cleaned flux and rad sensors. The wash was 80% full; we refilled it. The miniDOT was super hard to open. Even after I tightened down the hose clamp around the plastic cap, the hose clamp would still spin uselessly when I tried to use it for leverage to turn the cap. I ended up using a small pouch I had in my backpack that is made out of upcycled bicycle inner tube. I placed the pouch over the cap and tightened the hose clamp around over the pouch to get enough friction between the hose clamp and cap to open the cap. I downloaded the miniDOT data and changed its desiccant. The copper mesh was half disintegrated so we decided to leave it off. Ari added copper tape to all surfaces of the black plastic cap, leaving the sensing foil uncovered. SHF1 has been having weird downward spikes during the transitions from the lower low tide to high tide. I wanted to check its position so I picked my way through the wetland trying to find it. I think I got the right location but the plate was not obviously exposed or right under the surface, so I left it as is for now. Ari said she can clean the spikes out for now. The 7500 read: 436ppm CO2, 457mmol/m3 H2O, 12.6C, 101.9kPa, 105SS – 106 after cleaning The 7700 read: 2.33ppm CH4, 38RSSI – 87 after cleaning We left at 9:40 PST. |
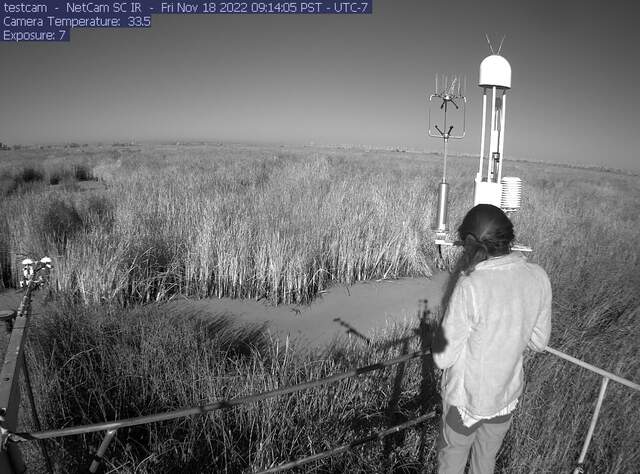
1 photos found

gilberttract_IR_2022_11_18_091405.jpg ( 2022-11-18 17:20:34 ) Full size: 1296x960
Ari on site in near IR
8 sets found
Can't check MBWPEESWGT_mixed
Can't check MBEEWPSWEPGT_cam
16 GT_met graphs found
4 GT_flux graphs found
3 GT_adcp graphs found
1 GT_cam graphs found
2 GT_usgs graphs found
2 GT_chanexo graphs found

