Field Notes
<--2022-10-19 12:10:00 | 2022-11-18 10:15:00-->Other sites visited today: Vaira | Tonzi | Gilbert Tract | West Pond | East End | Bouldin Alfalfa
Phenocam link: Searching...
Mayberry: 2022-11-03 12:50:00 (DOY 307)
Author: Daphne Szutu
Others: Kanishka
Summary: Regular data collection/cleaning, still low water level, swapped out TC17-25
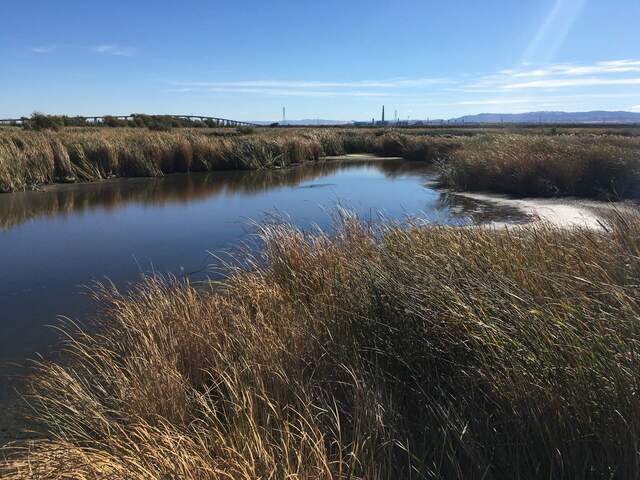
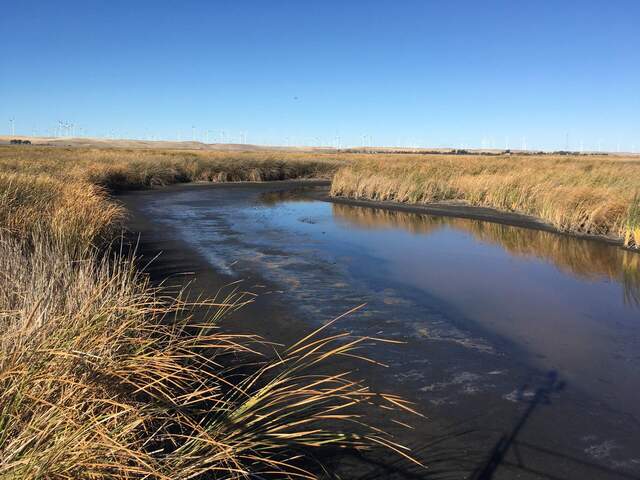
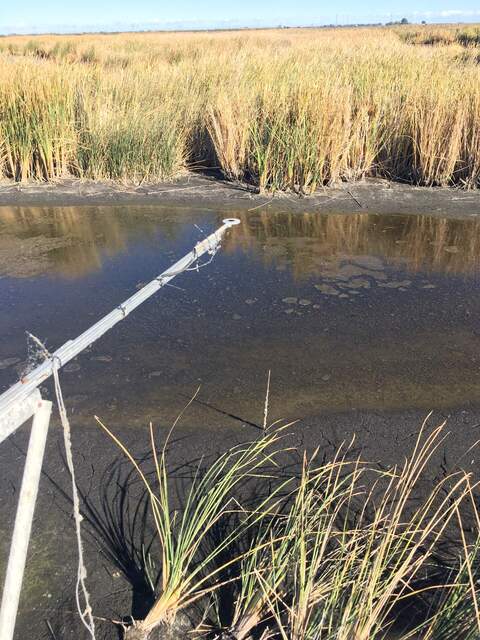
| 2022-11-03 Mayberry Kanishka and I arrived at 12:50. It was a sunny day but the cold wind made it feel much colder than the air temperature reading of ~15C. The water level is still super low here, but maybe ever so slightly higher after some rain two days ago. More rain is expected this weekend and next week. The ground around the tower is dry and the water level is definitely below the staff gauge. I meant to bring the supplies for moving the water sensor in the channel, but I forgot today. Another time--the channel will probably remain low for at least 2 weeks. I downloaded met, cam, and USB GHG data. I changed the eddy clock +30sec from 11:57:30 to 11:58 PST to match the laptop time and restarted logging. Kanishka cleaned flux and rad sensors. I topped off the wash reservoir (full of sleepy wasps). We also swapped out some of the thermocouple profiles today. Since the whole thermocouple rod was sheathed in one long piece of heat shrink, it was impossible to tell the depth of the individual thermocouple wires. Removed: TC 17-19: East of tower about 1.5m, in thick cattails, had to trample some of the cattails underneath the rad boom to get the rod out TC 20-22: Southwest of tower about 2m, in thick cattails TC 23-25, Southwest of tower about 1.5m, right next to a big cattail clump. This was supposed to be an "open water" measurement, but the cattails have encroached since this rod was installed in 2017. Installed: TC 17-22: East of tower about 2m on edge of cattails, close to where TC 20-22 were TC 23-25: North of tower about 1m in open water by boom The 7500 read: 407ppm CO2, 235mmol/m3 H2O, 14.9C, 101.6kPa, 100SS after cleaning The 7700 read: 2.0ppm CH4, 69RSSI – 81 after cleaning We left at 14:20 PDT. |
4 photos found

20221103MB_Channel1.jpg ( 2022-11-03 14:20:58 ) Full size: 1920x1440
Low water level in Mayberry channel

20221103MB_Channel2.jpg ( 2022-11-03 14:20:12 ) Full size: 1920x1440
Low water level in Mayberry channel

20221103MB_Rnet.jpg ( 2022-11-03 14:20:29 ) Full size: 1440x1920
"Open water" Rnet sensor is over cattails and mud

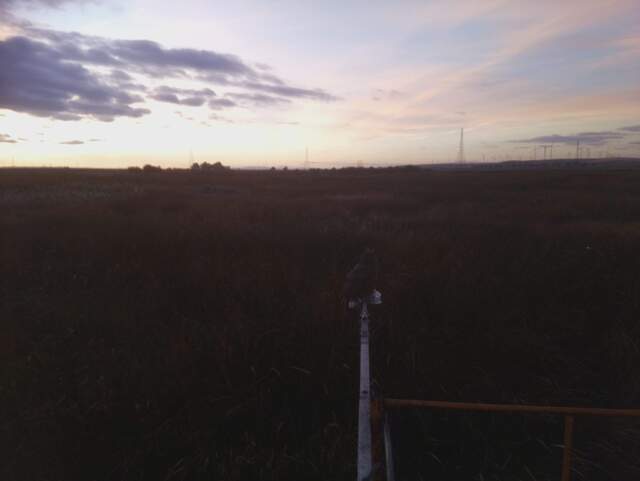
MB_picam_20221104_1715.jpg ( 2022-11-04 17:15:05 ) Full size: 1917x1440
Owl on radiometers
11 sets found
7 MB_flux graphs found
No data found for MB_met.
28 MB_tule graphs found
Can't check MBWPEESWGT_mixed
1 MB_cam graphs found
Can't check MBEEWPSWEPGT_cam
Can't check SIMBTWEE_met
1 MB_minidot graphs found
Can't check MBSWEEWPBCBA
1 MB_processed graphs found
Can't check MB_fd
1 MB_fd graphs found

