Field Notes
<--2022-10-19 09:35:00 | 2022-11-08 07:15:00-->Other sites visited today: Vaira | Tonzi | Mayberry | West Pond | East End | Bouldin Alfalfa
Phenocam link: Searching...
Gilbert Tract: 2022-11-03 10:00:00 (DOY 307)
Author: Daphne Szutu
Others: Ari, Kanishka
Summary: Regular data collection/cleaning, calibrated 3x fDOM sensors, deployed UCSC EXO and our miniDOT in channel
| 2022-11-03 Gilbert Tract Ari, Kanishka, and I arrived at 10:00 PDT. It was mostly clear and cool with a cold breeze. The water level was low-ish and rising. The water level was 22cm at 9:10 PST. I downloaded met and USB GHG data. I forgot the card reader so I didn't download the camera data. We'll be back next week for the 24hr tidal sampling campaign, so I can swap the card then. I changed the eddy clock +1min from 9:11 to 9:12 PST and restarted logging. Kanishka cleaned flux and rad sensors and we topped off the wash reservoir. The 7500 read: 415ppm CO2, 266mmol/m3 H2O, 9.95C, 101.9kPa, 100SS – 101 after cleaning The 7700 read: 2.0ppm CH4, 53RSSI – 87 after cleaning We got to Flo and the channel at 10:20 PDT. I downloaded data, synched its clock with the laptop, and restarted data collection. In the depth data, we could see more drops after 3-4 days of clean-looking data. There was some vegetation in the water, mostly caught with the flow on the sensor or mount itself. Ari got in the water with waders to clear most of it out with the shovel, but the water level was too high for her to actually reach the sensor. She suggested a trash picker/grabber in the future for getting at the underwater weeds. Around 10:30 PDT, Lyndsay from USGS met us at the channel to give us our fDOM sensor, our channel miniDOT, and their EXO housing. Our fDOM sensor sn 22C100780 was attached to the USGS EXO and we think it was running ok in the channel. The USGS EXO did not have data for the last 3 months so it is going back to the factory for repair. Since we need water sensors for next week's tidal sampling campaign, Ari borrowed the UCSC EXO. We will install our fDOM sensor and install the EXO in the channel today. Before installation though, we calibrated our fDOM sensor and the 2 UCSC fDOM sensors in the field using miliQ water and a 300ppb QSE in 0.05M sulfuric acid solution that Ari had prepared previously. The exact concentration of the solution is temperature dependent, so you need to look up the span QSU/FNU in the manual. I also downloaded the data from the channel miniDOT sn 1221 and changed its batteries and desiccant. After the fDOM sensors were calibrated, Ari left our fDOM sensor and one of the UCSC fDOM sensors attached. We sent the EXO a new deployment that samples every 15 minutes using 1 minute bursts (I think). Ari attached the EXO to the USGS housing and had a clever way of using zipties to "cushion" around the EXO guard so the sensors would remain in place inside of the housing. We deployed the UCSC EXO and our miniDOT on the USGS post in the channel. We discovered the smallest waders not only have a leak near the right boot where there's a hole in the neoprene, but also near the right seam of the front pouch. We left at 12:10 PDT. Ari went home and Kanishka and I went on to Mayberry. |
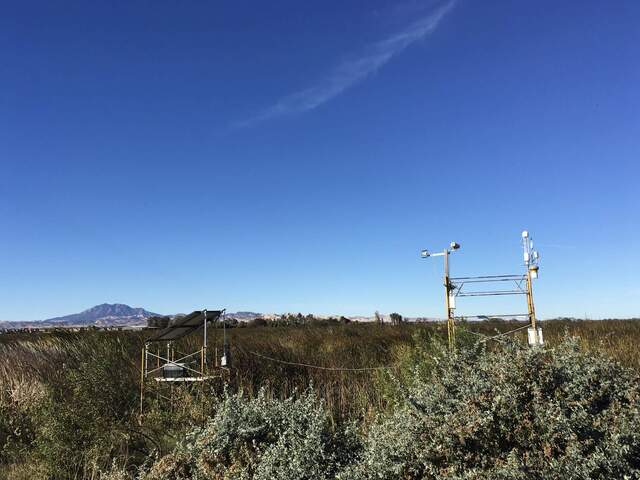
1 photos found

20221103GT_Tower.jpg ( 2022-11-03 10:18:35 ) Full size: 1920x1440
Tower and solar panels on a clear fall morning
8 sets found
Can't check MBWPEESWGT_mixed
Can't check MBEEWPSWEPGT_cam
16 GT_met graphs found
4 GT_flux graphs found
3 GT_adcp graphs found
1 GT_cam graphs found
2 GT_usgs graphs found
No data found for GT_chanexo.

