
Field Notes
<--2022-09-28 12:05:00 | 2022-11-03 12:50:00-->Other sites visited today: Gilbert Tract | West Pond | East End
Phenocam link: Searching...
Mayberry: 2022-10-19 12:10:00 (DOY 292)
Author: Daphne Szutu
Others: Robert, Kyle
Summary: Regular data collection/cleaning, very low water levels, sleepy wasps, measured lengths for new thermocouple rods
| 2022-10-19 Mayberry Robert, Kyle D., and I arrived at 12:10 PDT. It was warm and sunny. We passed some small groups of sheep here and there on the interior levee roads, although we didn’t drive through any sheep gates. The water level is still going down. The channel north of the tower now just holds separate ponds of water; it’s no longer one continuous water body. Probably the water level will remain low until it starts raining and the water quality (salinity) in the river improves. The water level is below the staff gauge level and the mud below the tower is firm enough to walk around without waterproof boots. The "water" radiometers are over mud. I downloaded met, cam, and USB GHG data. I changed the eddy clock +1min around 11:20 PST and restarted logging. I downloaded the miniDOT data and changed its desiccant, even though the miniDOT has been out of the water for a while. I checked the conductivity sensor as part of its routine check every 3 months, even though it’s also been out of the water for a while. I cleaned a dead spider out of its orifice. Robert and Kyle cleaned flux and rad sensors. There were many wasps in the wash box. I think the reservoir was pretty full, and I don’t remember if we topped it off or not. Robert clipped back some of the reeds by the boardwalk. I made some measurements to start replacing the thermocouples. The water thermocouples need about 4m of wire. The tule thermocouples need about 5-6m of wire. The 7500 read: 421ppm CO2, 500mmol/m3 H2O, 28.3C, 101.1kPa, 98SS -- 101 after cleaning The 7700 read: 2.16ppm CH4, 35RSSI – 86 after cleaning We left at 12:45 PDT. |
6 photos found

20221019MB_FluxSensors.jpg ( 2022-10-19 12:39:36 ) Full size: 1920x1440
Flux sensors against backdrop of very low water level

20221019MB_LowWater1.jpg ( 2022-10-19 12:39:18 ) Full size: 1920x1440
Super low water level

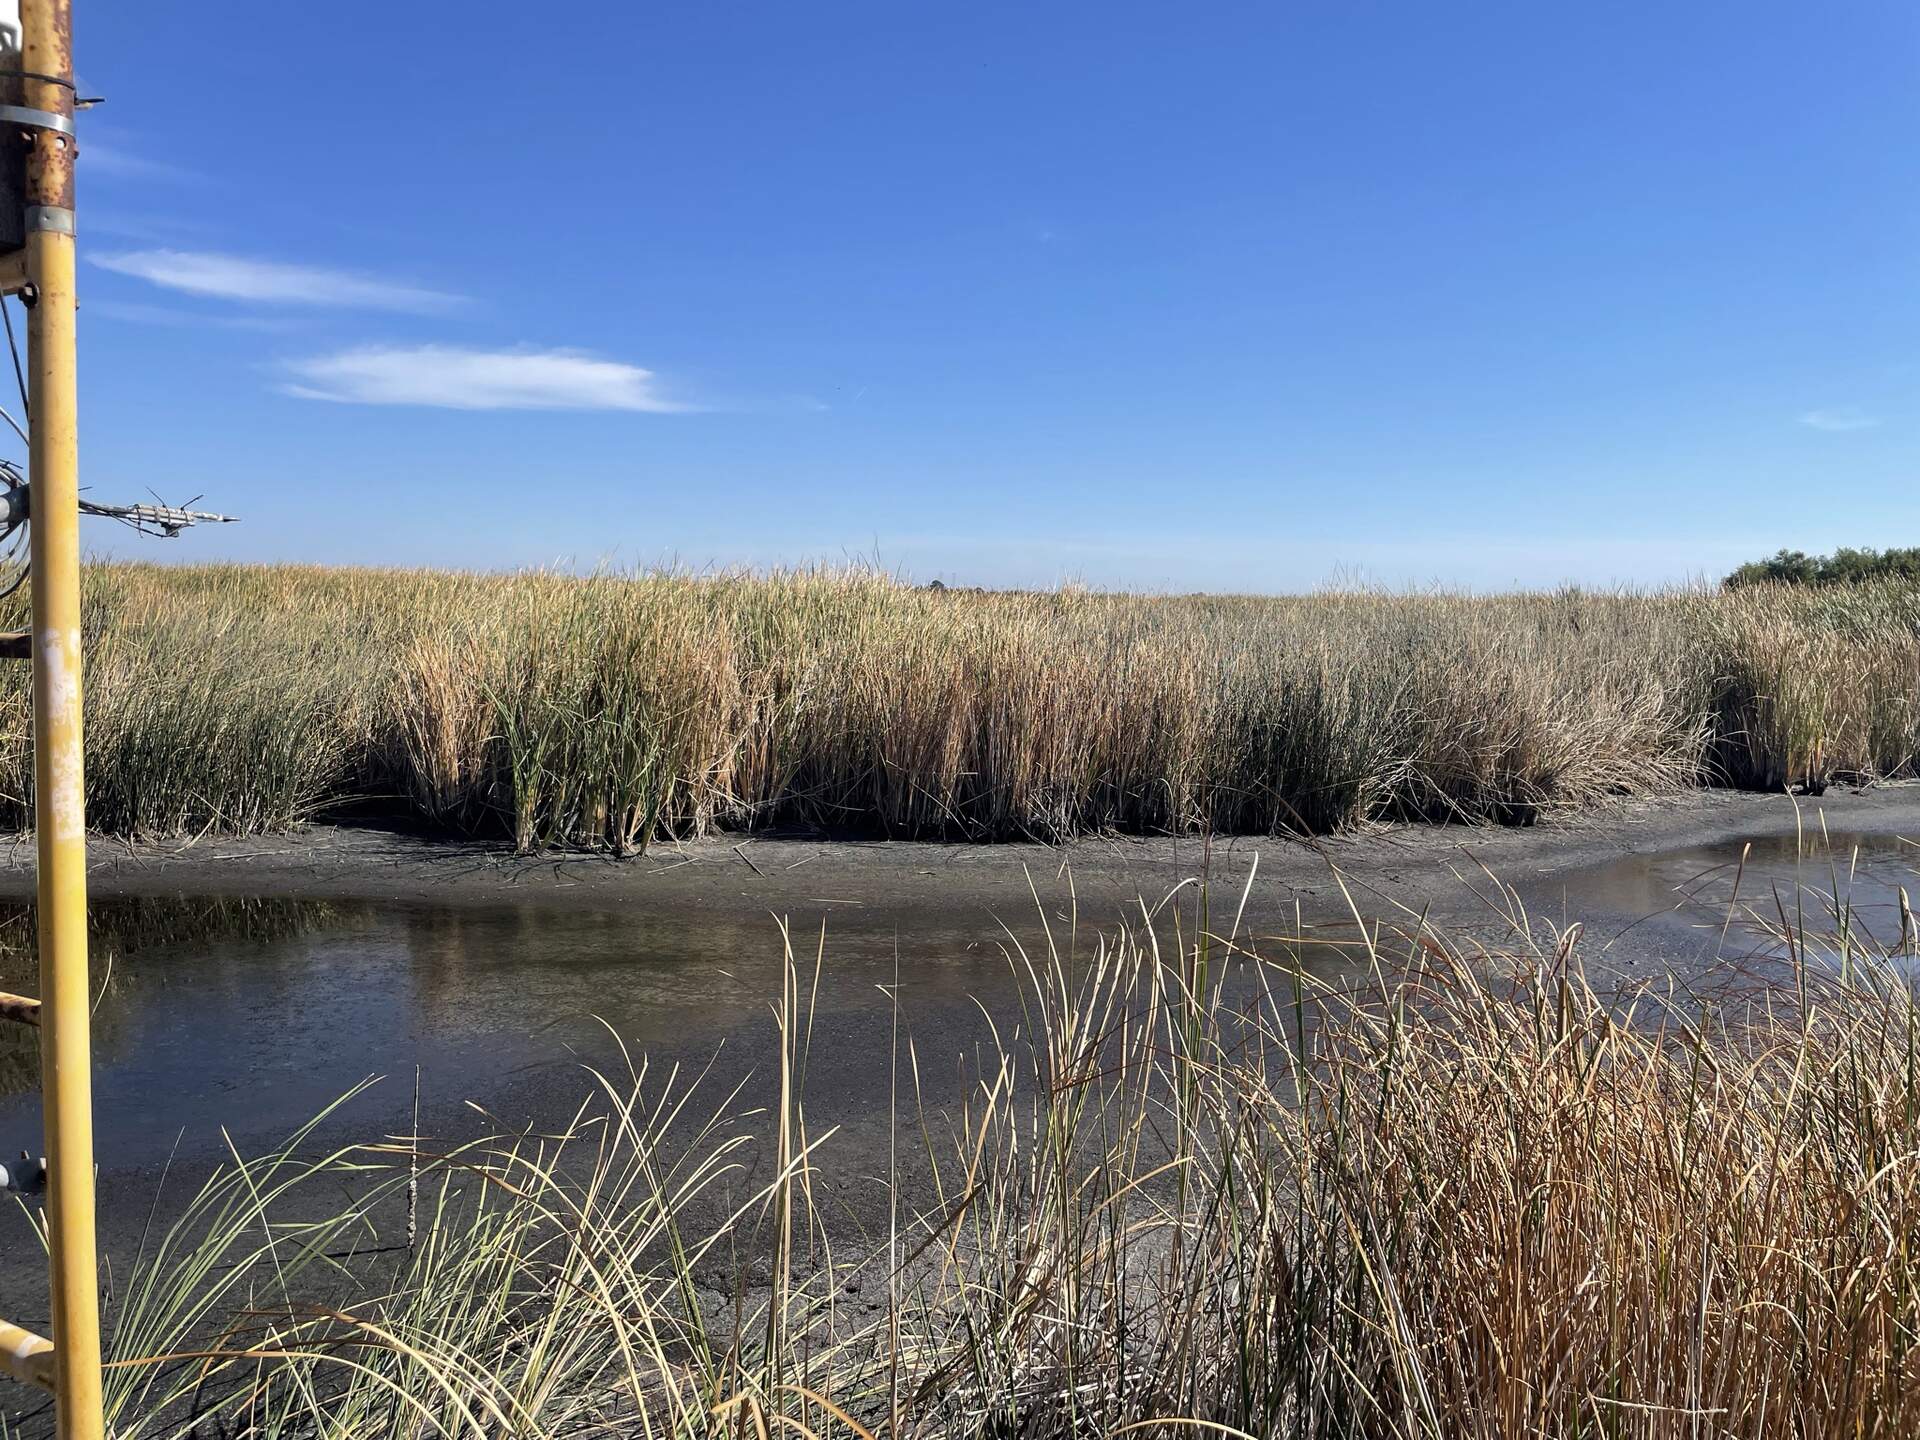
20221019MB_LowWater2.jpg ( 2022-10-19 12:39:25 ) Full size: 1920x1440
Super low water level--no longer one continuous body of water

20221019MB_LowWater3.jpg ( 2022-10-19 12:39:52 ) Full size: 1920x1440
Super low water level--no longer one continuous body of water. "Water" radiometers are now looking at mud.
20221019MB_SenescentVeg.jpg ( 2022-10-19 12:38:43 ) Full size: 1920x1440
Super low water and senescing vegetation

20221019MB_Wasps.jpg ( 2022-10-19 12:36:11 ) Full size: 1440x1920
Wasps in the wash box. The wasp facing us head on had a slightly different body, larger and a lighter orange color.
11 sets found
7 MB_flux graphs found
No data found for MB_met.
28 MB_tule graphs found
Can't check MBWPEESWGT_mixed
1 MB_cam graphs found
Can't check MBEEWPSWEPGT_cam
Can't check SIMBTWEE_met
1 MB_minidot graphs found
Can't check MBSWEEWPBCBA
1 MB_processed graphs found
Can't check MB_fd
1 MB_fd graphs found