Field Notes
<--2022-10-05 09:15:00 | 2022-11-02 17:20:00-->Other sites visited today: Bouldin Alfalfa | Bouldin Corn
Phenocam link: Searching...
Hill Slough: 2022-10-18 09:55:00 (DOY 291)
Author: Daphne Szutu
Others: Dennis, Carlos
Summary: Regular data collection/cleaning, Calm day, Rinsed off EXO, Need more work on mounting water quality sensors
| 2022-10-18 Hill Slough Dennis, Carlos, and I arrived at 9:55 PDT. It was a bit later than usual because the rental car wasn’t ready until 8:30am. Eric, Iryna’s student, also joined us for most of the day. It was calm (for once) and mostly cloudy. Dennis observed there was no ebullition from the channel. The water level was middling; the staff gauge read 4.45ft at 9:13 PST. At the channel, Carlos, Dennis, and Eric cleaned the EXO sensor. There weren’t too many crustaceans (opossum shrimp) this time and the sensor lenses looked clean, so they kept the guard on and rinsed off the sensors with the pump sprayer. I downloaded met, cam, and USB GHG. The water quality data from the channel sensors looked reasonable. I’ll need to define a new data stream version to include these new columns in the HS_met table. The 7700 optics RH was 23%, so it should be changed during the next 7700 calibration in January. The wash reservoir was 1/3 empty; we refilled it. I changed the eddy clock +45sec from 9:02:20 to 9:03:05 and restarted logging. I also collected a water sample from the sipper to check its conductivity later. The water sample is labeled and stored in the lab refrigerator. Sample, temperature-compensated conductivity, temperature, notes Porewater, 20.66 mS,,Sample stored in fridge before being measured 9:15 PST Carlos and Eric cleaned the flux and rad sensors and reported the LWin sensor was muddy. Carlos set up the ladder by the boardwalk and climbed down to clean and read the staff gauge. The 7500 read: 441ppm CO2, 690mmol/m3 H2O, 19.5C, 102.1kPa, 101SS -- 101 after cleaning The 7700 read: 2.46ppm CH4, 38RSSI – 69 after cleaning Back at the channel, I downloaded the miniDOT data and Carlos changed its desiccant. The pantyhose stayed on just fine with a rubber band and worked great to keep the miniDOT clean. The EXO sensor is on its own yellow chain but the other three sensors (miniDOT, eosGP, and CTD) are attached to the same chain. Their positions on the chain are not secure, so we might have slightly changed the depths of the miniDOT, eosGP, and/or CTD when pulling the miniDOT up and putting it back in. Next time we come at low tide: - Mount eosGP and CTD on their own eyebolts and yellow plastic chain - Add copper tape to eosGP and CTD - Standardize eosGP, CTD, miniDOT, EXO depths - Install 2nd staff gauge at the channel and note its depth relative to the main staff gauge by the tower We left at 10:30 PDT to rush to Bouldin Alfalfa to catch the Landsat 8 overpass. |
1 photos found

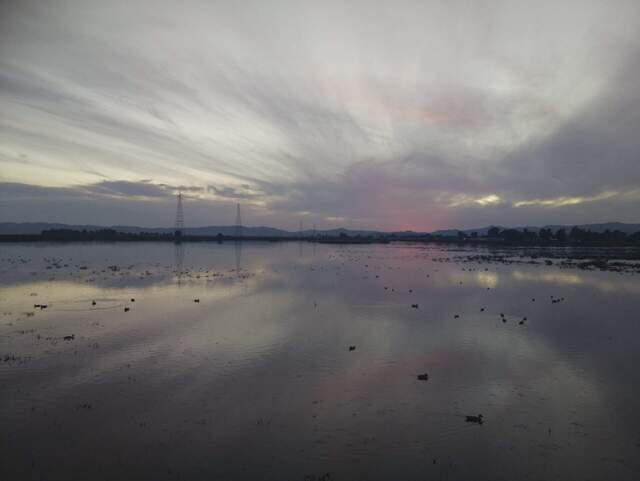
HS_picam_20221017_1745.jpg ( 2022-10-17 17:45:06 ) Full size: 1920x1442
Nice reflection at sunset
4 sets found
21 HS_met graphs found
4 HS_flux graphs found
1 HS_cam graphs found
Can't check HS_Processed
2 HS_Processed graphs found

