Field Notes
<--2005-09-10 12:30:00 |
2005-10-04 00:00:00-->
Phenocam link:
Searching...Tonzi: 2005-09-25 13:00:00 (DOY 268)
Author: Siyan Ma
Others:
When: Date: 9/25/2005 ,
Day: 268 ,
Watch Time: 13:00 .
Where: Tonzi/Vaira Ranch
Who: Siyan
Weather:
clear with some white cloud
Phenology:
dead grass, yellow spots on oak leafs.
Trees around the tower showed yellow leaves. Cows are around at Vaira Site.
Summary
- check Flux systems, download
data: floor & tower met data
from Day 220-now.
- Soil CO2 profile system, tree spot #2 temp broken.
- collect oak leaf samples in
Tonzi
- Alexander’s isotope samples
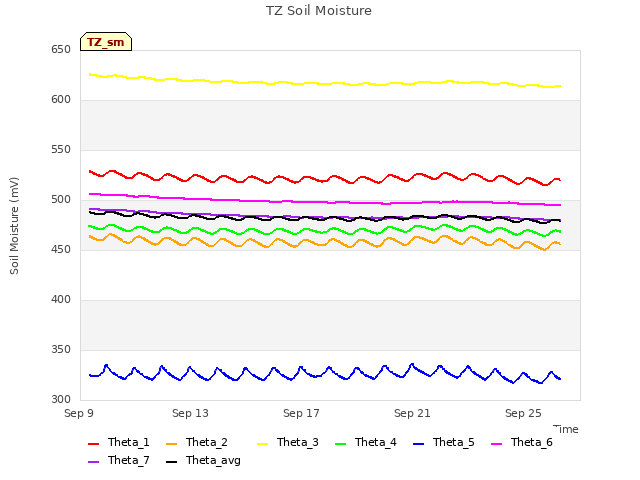
- measure soil moisture
- read dendrometer
Vaira_Grass
Site
- Fence and gate power: >12 v.
- Panel and Batteries: 12.9 v; 5.4 amps; 3.0 amps.
- Reading from Gillsonic screen
before downloading data. (The value
of H2O and CO2 should be in the range of 0 – 5 v.)
Time
|
14:43:41
|
Path/File name
|
|
|
mean
|
std
|
|
mean
|
std
|
w
|
0.15
|
0.29
|
Ts
|
29.27
|
1.19
|
u
|
0.78
|
0.65
|
H2O
|
1.602
|
0.01
|
v
|
0.30
|
0.39
|
CO2
|
1.602
|
0.02
|
- Check CR23X with two
multiplexers
Sys_vot = 2.36
PC_start = 1.27
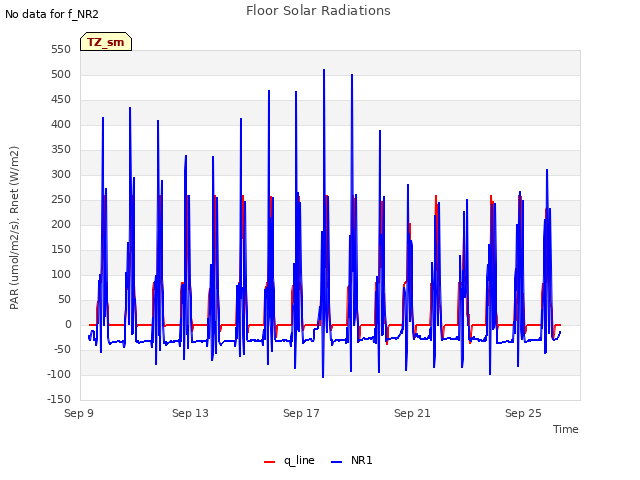
- Check levels of Radiation
sensors, clear up surfaces.
9. Closed gate and
set up fence.
Tonzi_Tower Site
- Fence and gate power: >12 v.
- Panel and Batteries: 13.5 v; 0.0 amps; 5.6 amps.
- Reading from Gillsonic screen
before downloading data. (The value
of H2O and CO2 should be in the range of 0 – 5 v.)
Time
|
12:44:37
|
Path/File name
|
D:\Data\T05_268.flx
D:\Data\TW052681243.raw
|
|
mean
|
std
|
|
mean
|
std
|
w
|
0.490
|
0.642
|
Ts
|
25.64
|
1.601
|
u
|
3.30
|
0.723
|
H2O
|
1.50
|
0.06
|
v
|
0.940
|
1.736
|
CO2
|
1.569
|
0.97
|
- Check calibration cylinders;
CO 2 800 psig; flow 12
psi.
N 2 750
psig; flow 18 psi.
- close gate and set up fence.
Toniz_Floor
Site
- Fence and gate power: 0
v. A wire disconnected
with battery.
- Panel and Batteries: 13.8 v; 13.8 amps; 1.9
amps.
- Reading from Gillsonic screen
before downloading data. (The value
of H2O and CO2 should be in the range of 0 – 5 v.)
Time
|
13:09:49
|
Path/File name
|
|
|
mean
|
std
|
|
mean
|
std
|
w
|
0.19
|
0.426
|
Ts
|
24.128
|
0.522
|
u
|
0.51
|
0.673
|
H2O
|
1.34
|
0.015
|
v
|
3.26
|
0.530
|
CO2
|
1.673
|
0.008
|
- Check MD-9 system connections
are good
CR23X3 – floor-Met
CR23X5 – soil CO 2
profile
CR23X6 – tower-Met
CR10X2 – floor-Met
CR10X4 – sap-flow
CR10X7 – CO 2 profile
CR10X8 – wind profile
- Soil CO2 profile
Reading
from datalogger
Panel
temp
|
32.88
|
|
|
Battery
voltage
|
13.09
|
|
|
CO2E_1
|
244.24
|
TCE_1
|
32.21
|
CO2W_1
|
372.90
|
TCW_1
|
31.521
|
CO2E_2
|
256.49
|
TCE_2
|
-9999
|
CO2W_2
|
605.83
|
TCW_2
|
27.338
|
CO2E_3
|
282.00
|
TCE_3
|
31.875
|
CO2W_3
|
1117.1
|
TCW_3
|
23.428
|
CO2E_4
|
186.60
|
TCE_4
|
26.403
|
CO2W_4
|
942.86
|
TCW_4
|
26.027
|
Reading
from panels of analyzers
depth
|
Open
|
order
|
depth
|
Tree
|
order
|
2cm
(1%)
|
510
|
1
|
2cm
(1%)
|
720
|
1
|
4cm
|
540
|
2
|
4cm
|
1150
|
4
|
8cm
|
560
|
3
|
8cm
|
0.44%
|
2
|
16cm
|
410
|
4
|
16cm
|
1910
|
3
|
- Close gate and set up fence.
tonzi
|
7931AFE
|
402165
|
574B4B
|
402FF3
|
574632
|
7A432E
|
7A3C6E
|
7A3B40
|
7A4AAA
|
D268
|
|
|
|
|
|
|
|
|
|
25-Sep-05
|
SM
|
|
|
|
|
|
|
|
|
0-15
|
6.8
|
4.5
|
5.9
|
1.4
|
7.7
|
4.9
|
5.1
|
3.4
|
1.3
|
15-30
|
12.8
|
13.9
|
12.6
|
10.2
|
10.7
|
6.9
|
12.1
|
11.1
|
1.9
|
30-45
|
17.8
|
5.5
|
12.8
|
13.7
|
7.2
|
10.3
|
13.2
|
15.3
|
12.7
|
45-60
|
11.7
|
3.1
|
5.6
|
10.1
|
12.0
|
9.9
|
12.4
|
18.0
|
9.4
|
|
|
|
|
|
|
|
|
|
|
|
A6D882B
|
A3D04E8
|
A6D72F5
|
|
|
|
|
|
|
|
|
|
|
|
|
|
|
|
|
0-15
|
6.0
|
6.0
|
1.3
|
|
|
|
|
|
|
15-30
|
7.2
|
6.8
|
9.8
|
|
|
|
|
|
|
30-45
|
16.4
|
17.0
|
13.7
|
|
|
|
|
|
|
45-60
|
17.1
|
16.4
|
2.3
|
|
|
|
|
|
|
|
|
|
|
|
|
|
|
|
|
vaira
|
57318a
|
7933dee
|
|
|
|
|
|
|
|
0-15
|
1.9
|
1.4
|
|
|
|
|
|
|
|
15-30
|
5.7
|
8.3
|
|
|
|
|
|
|
|
30-45
|
13.8
|
12.5
|
|
|
|
|
|
|
|
45-60
|
16.3
|
17.3
|
|
|
|
|
|
|
|
Tonzi
|
|
9/25/2005
|
|
Dendrometer
|
268
|
|
|
|
|
|
Date
|
Day
|
Tag #
|
Reading (cm)
|
9/25/2005
|
268
|
71
|
22.5
|
|
|
72
|
23.1
|
|
|
77
|
-
|
|
|
78
|
-
|
|
|
79
|
22.7
|
|
|
245
|
18.5
|
|
|
248
|
22.4
|
|
|
250
|
21.2
|
|
|
255
|
20.9
|
|
|
252
|
missing
|
|
|
102
|
Broken
|
Sample vial
|
What
|
MIBA-US-01._114___
|
Leave 1
|
MIBA-US-01.__115__
|
Leave 2
|
MIBA-US-01. ___-_
|
Grass 1
|
MIBA-US-01. ___-_
|
Grass 2
|
MIBA-US-01. ___-_
|
Surface Litter
|
MIBA-US-01. ___116_
|
Soil in 10 cm
|
MIBA-US-01. __117__
|
Stem 1
|
MIBA-US-01. ___118_
|
Stem 2
|
|
Field Data
No tank data
No TZ Well data found
No TZ Moisture Point data found
No VR Moisture Point data found
No TZ grass heigth found
No VR grass heigth found
No TZ Tree DBH found
No water potential data found
No TZ Grass Biomass data found
No TZ OakLeaves Biomass data found
No TZ PineNeedles Biomass data found
0 photos found
16 sets found
No data found for TZ_Fenergy.
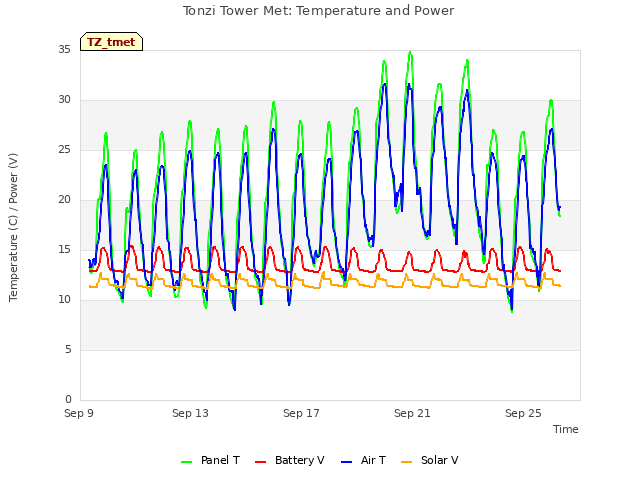
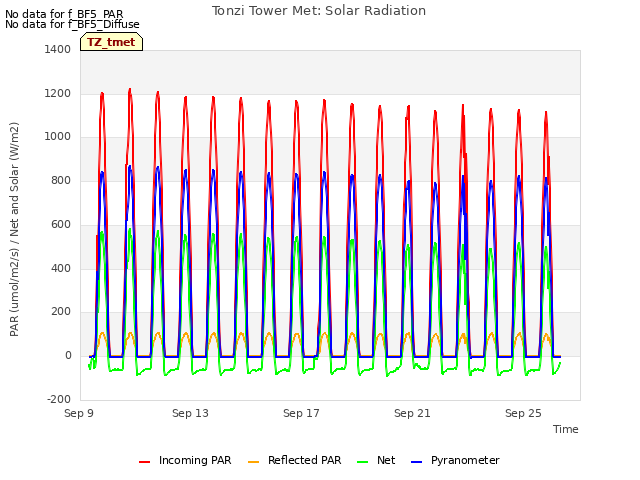
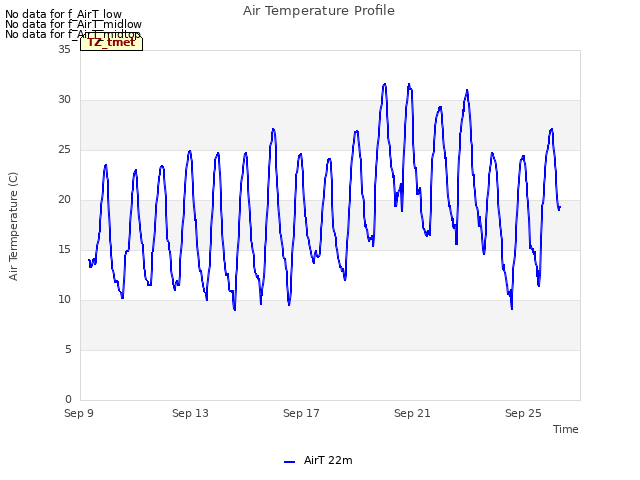
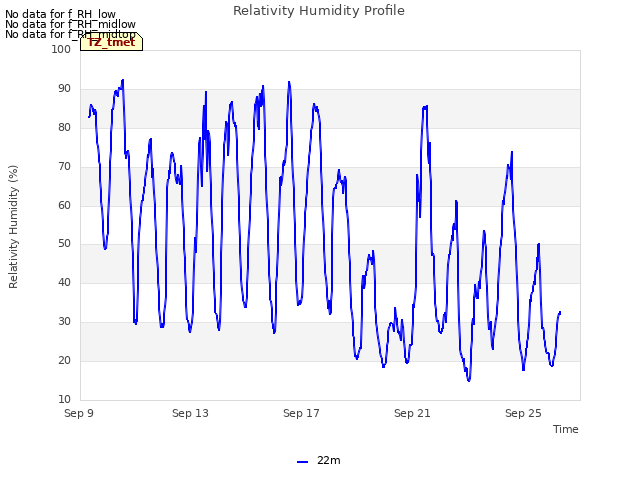
11 TZ_tmet graphs found


No data found for TZ_soilco2.
Can't check TZ_mixed
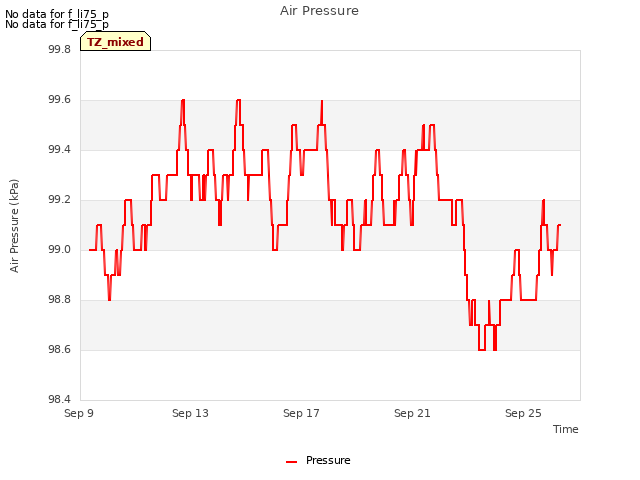
3 TZ_mixed graphs found

No data found for TZ_fflux.
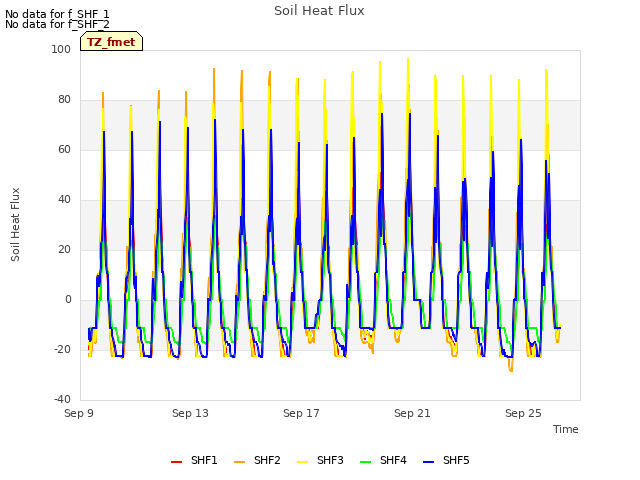
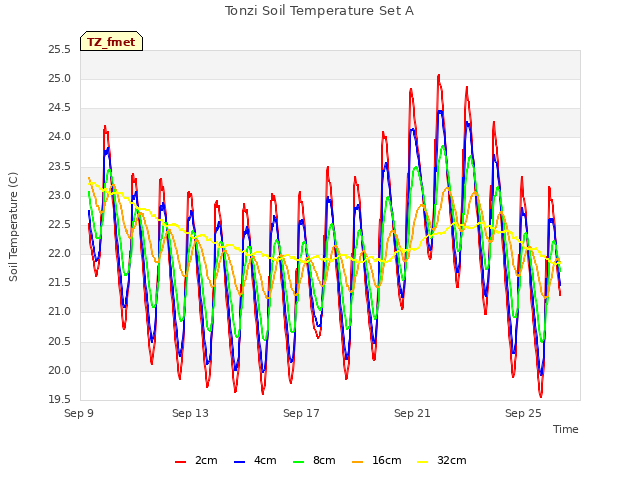
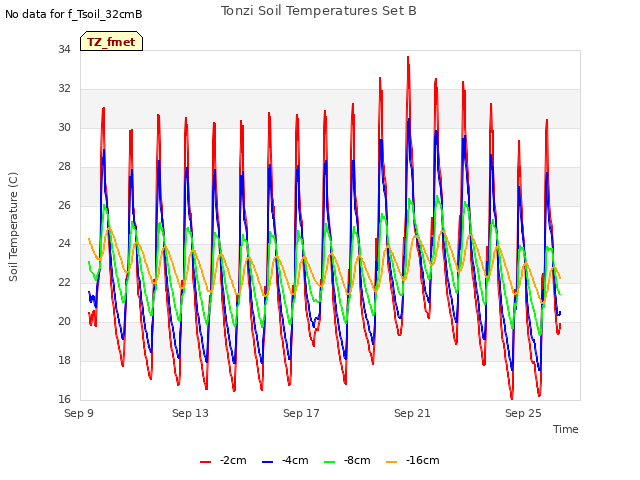
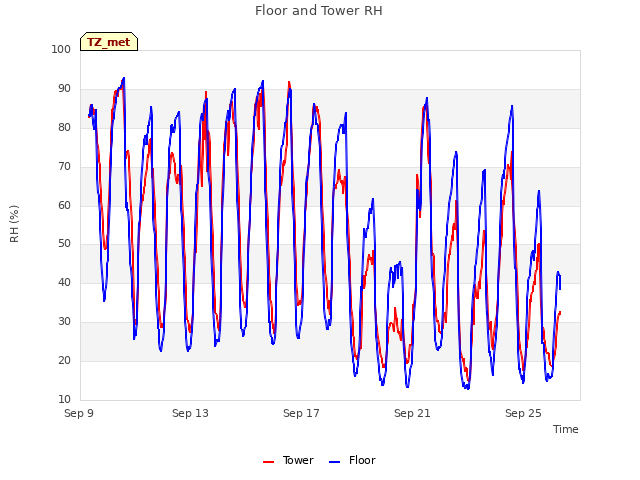
8 TZ_fmet graphs found


No data found for TZ_tram.
No data found for TZ_co2prof.
No data found for TZ_irt.
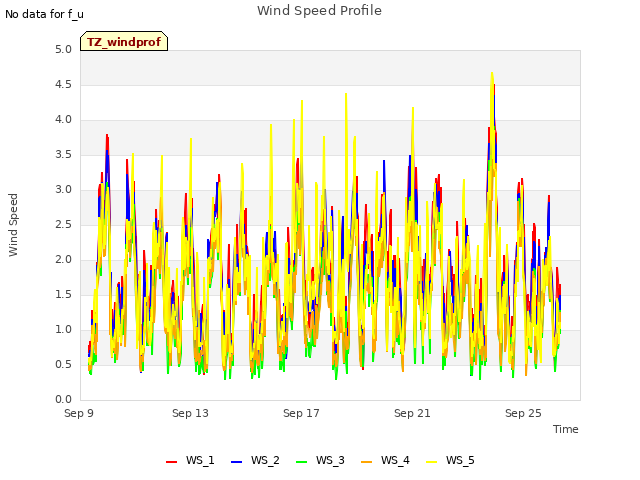
1 TZ_windprof graphs found
No data found for TZ_tflux.
2 TZ_sm graphs found
Can't check TZ_met
1 TZ_met graphs found
Can't check TZVR_mixed
No data found for TZ_osu.
No data found for TZ_fd.
Tonzi Z-cam data


