Field Notes
<--2005-08-11 00:00:00 |
2005-09-25 13:00:00-->
Phenocam link:
Searching...Tonzi: 2005-09-10 12:30:00 (DOY 253)
Author: Siyan Ma
Others:
When: Date: Sep. 10, 2005 ,
Day: 253 ,
Watch Time: 12:30 .
Where: Tonzi/Vaira
Ranch
Who: Siyan
Weather: Clear,
nice breeze, 70oF
Phenology: dead grass, oak leaves looks healthy and
green, but there are some yellow/brown spots on the leaves. It is easy to fall down when I touch them.
Summary
- Flux
systems works very well. Three
Licor-7500s are swapped. I downloaded data.
- The
rope was not rolled properly. One
end of the rope was all the way up to the top. One holder of the tower was lying on the
ground.
- Soil CO2 profile system: the readings from the datalogger shows
that the second temperature (4cm) of East site (under tree) didn’t work,
-9999.
- Tower CO2 profile system: pump works well.
- Oak
samples in Tonzi are collected for leaf area and nitrogen
measurement. I also collect some
leaf samples for Mattias’ light transmission measurement.
- Alexander’s
isotope samples. Done.
- Soil
moisture: tope 10 cm is very very
dry.
- Dendrometer.
Done.
Vaira_Grass Site
- Fence
and gate power: >12 v.
- Panel
and Batteries: 13.1 v; 4.0 amps; 1.8 amps.
- Reading
from Gillsonic screen before downloading data. (The value of H2O and CO2
should be in the range of 0 – 5 v.)
Time
|
|
Path/File
name
|
|
|
mean
|
std
|
|
mean
|
std
|
w
|
0.38
|
0.252
|
Ts
|
24.730
|
1.259
|
u
|
1.50
|
0.618
|
H2O
|
2.646
|
0.017
|
v
|
2.66
|
0.614
|
CO2
|
1.549
|
0.021
|
- Remove
SN# 35 ; install SN# 41 .
- Readings
are OK after swapping.
- Check
CR23X with two multiplexers
Sys_vot = 2.4
PC_start = 1.22
- Check
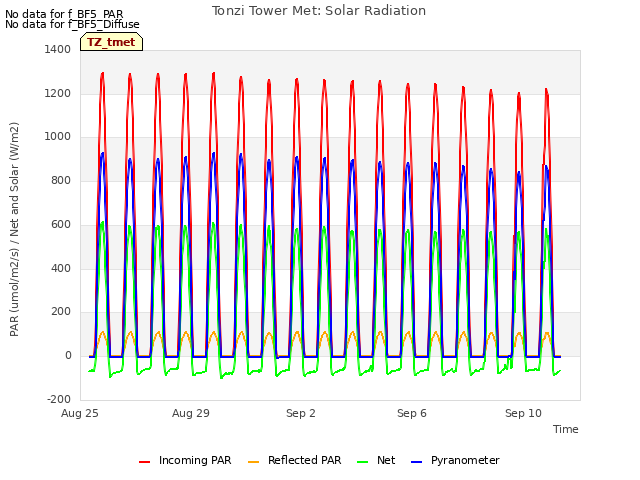
levels of Radiation sensors, clear up surfaces.
9.
Closed gate and set up fence.
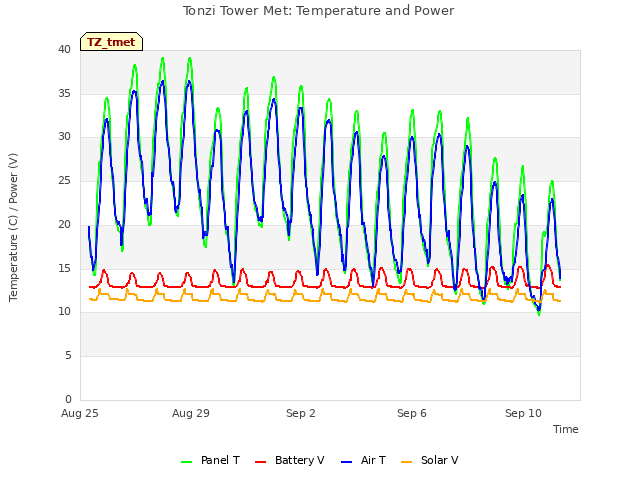
Tonzi_Tower Site
- Fence
and gate power: >12 v.
- Panel
and Batteries: 13.5 v; 0.0 amps; 5.5 amps.
- Reading
from Gillsonic screen before downloading data. (The value of H2O and CO2
should be in the range of 0 – 5 v.)
Time
|
11:40:40
|
Path/File
name
|
D:\data\t05_253.flx
D:\data\TW052531130.raw
|
|
mean
|
std
|
|
mean
|
std
|
w
|
0.520
|
0.685
|
Ts
|
18.239
|
0.3
|
u
|
0.680
|
1.201
|
H2O
|
2.560
|
0.016
|
v
|
1.990
|
1.469
|
CO2
|
1.697
|
0.01
|
- Licor
7500: Remove SN# 42 ; install SN# 65 .
- Check
calibration cylinders;
CO 2 800
psig; flow 18 psi.
N 2 820
psig; flow 7 psi.
- close
gate and set up fence.
Toniz_Floor Site
- Fence
and gate power: ~6-7 v.
- Reading
from Gillsonic screen before downloading data. (The value of H2O and CO2
should be in the range of 0 – 5 v.)
Time
|
|
Path/File
name
|
|
|
mean
|
std
|
|
mean
|
std
|
w
|
-0.03
|
0.30
|
Ts
|
19.9
|
0.707
|
u
|
0.66
|
0.74
|
H2O
|
2.564
|
0.05
|
v
|
2.03
|
0.909
|
CO2
|
1.748
|
0.012
|
- The
holder of the computer couldn’t hold the computer in vertical in the
enclosure.
- Swaping
Li-7500 Analyzer: Remove SN# 418 ; install SN# 73
- Soil
CO2 profile
Reading from
datalogger
Panel temp
|
20.166
|
|
|
Battery voltage
|
13.166
|
|
|
CO2E_1
|
265.76
|
TCE_1
|
32.504
|
CO2W_1
|
305.36
|
TCW_1
|
30.26
|
CO2E_2
|
286.64
|
TCE_2
|
-9999
|
CO2W_2
|
472.05
|
TCW_2
|
26.065
|
CO2E_3
|
334.03
|
TCE_3
|
34.709
|
CO2W_3
|
1156.8
|
TCW_3
|
23.480
|
CO2E_4
|
217.88
|
TCE_4
|
30.216
|
CO2W_4
|
955.69
|
TCW_4
|
26.406
|
Reading from panels of analyzers
depth
|
Open
|
order
|
depth
|
Tree
|
order
|
2cm (1%)
|
520
|
1
|
2cm (1%)
|
620
|
1
|
4cm
|
580
|
2
|
4cm
|
1930
|
4
|
8cm
|
670
|
3
|
8cm
|
940
|
2
|
16cm
|
420
|
4
|
16cm
|
0.46%
|
3
|
- Close
gate and set up fence.
Soil Moisture
tonzi
|
7931AFE
|
402165
|
574B4B
|
402FF3
|
574632
|
7A432E
|
7A3C6E
|
7A3B40
|
7A4AAA
|
D253
|
|
|
|
|
|
|
|
|
|
10-Sep-05
|
SM
|
|
|
|
|
|
|
|
|
0-15
|
4.6
|
4.8
|
11.1
|
1.2
|
5.4
|
4.8
|
5.3
|
3.4
|
1.4
|
15-30
|
12.8
|
13.1
|
11.1
|
10.1
|
9.6
|
7.2
|
12.0
|
11.4
|
1.9
|
30-45
|
17.5
|
4.8
|
12.7
|
14.3
|
9.6
|
9.9
|
13.6
|
15.7
|
12.8
|
45-60
|
12.0
|
3.1
|
5.5
|
10.7
|
12.1
|
9.7
|
12.4
|
18.8
|
9.9
|
|
|
|
|
|
|
|
|
|
|
|
A6D882B
|
A3D04E8
|
A6D72F5
|
|
|
|
|
|
|
|
|
|
|
|
|
|
|
|
|
0-15
|
6.2
|
5.9
|
1.5
|
|
|
|
|
|
|
15-30
|
7.4
|
7.2
|
10.4
|
|
|
|
|
|
|
30-45
|
16.3
|
17.9
|
14.4
|
|
|
|
|
|
|
45-60
|
17.8
|
17.3
|
2.1
|
|
|
|
|
|
|
|
|
|
|
|
|
|
|
|
|
vaira
|
57318a
|
7933dee
|
|
|
|
|
|
|
|
0-15
|
(11.1)
|
(1.4)
|
|
|
|
|
|
|
|
15-30
|
4.7
|
8.5
|
|
|
|
|
|
|
|
30-45
|
13.8
|
12.7
|
|
|
|
|
|
|
|
45-60
|
16.6
|
17.4
|
|
|
|
|
|
|
|
Notes: number in ( ) means the readings were twinkling.
Tonzi
|
|
|
|
Dendrometer
|
|
|
|
|
|
|
Date
|
Day
|
Tag #
|
Reading (cm)
|
9/10/2005
|
253
|
71
|
22.6
|
9/10/2005
|
253
|
72
|
23.1
|
9/10/2005
|
253
|
77
|
No
dendrometer found
|
9/10/2005
|
253
|
78
|
No
dendrometer found
|
9/10/2005
|
253
|
79
|
22.9
|
9/10/2005
|
253
|
245
|
19
|
9/10/2005
|
253
|
248
|
22.5
|
9/10/2005
|
253
|
250
|
21.6
|
9/10/2005
|
253
|
255
|
21.4
|
9/10/2005
|
253
|
102
|
5.2
|
Sample
vial
|
What
|
MIBA-US-01._106___
|
Leave
1
|
MIBA-US-01.__107__
|
Leave
2
|
MIBA-US-01.
___-_
|
Grass
1
|
MIBA-US-01.
___-_
|
Grass
2
|
MIBA-US-01.
_108_
|
Surface
Litter
|
MIBA-US-01.
_109
|
Soil
in 7cm
|
MIBA-US-01.
_110
|
Stem
1
|
MIBA-US-01.
_111
|
Stem
2
|
|
Field Data
No tank data
No TZ Well data found
No TZ Moisture Point data found
No VR Moisture Point data found
No TZ grass heigth found
No VR grass heigth found
No TZ Tree DBH found
No water potential data found
No TZ Grass Biomass data found
No TZ OakLeaves Biomass data found
No TZ PineNeedles Biomass data found
0 photos found
16 sets found
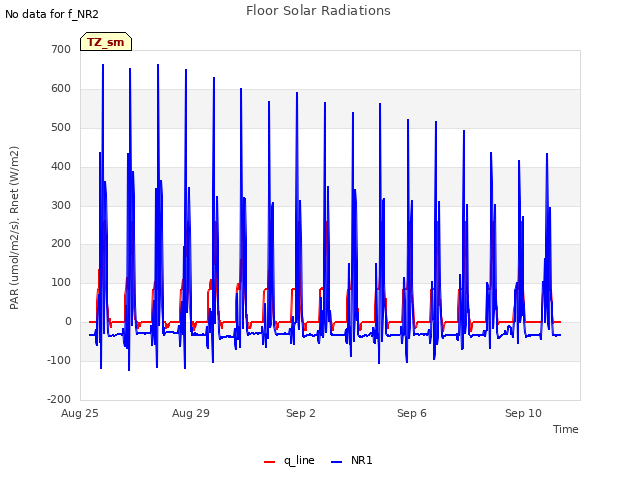
No data found for TZ_Fenergy.
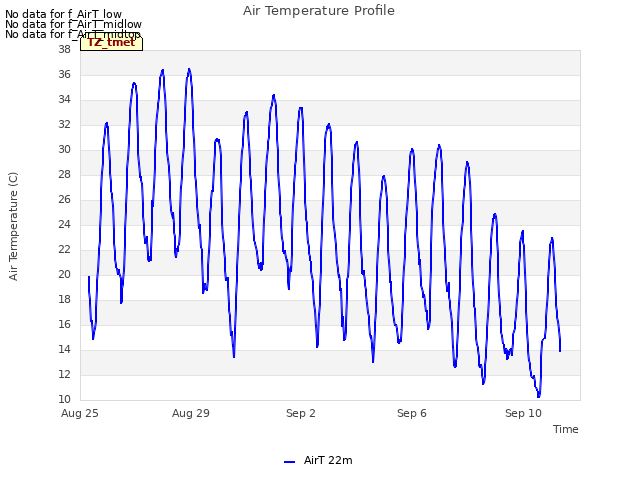
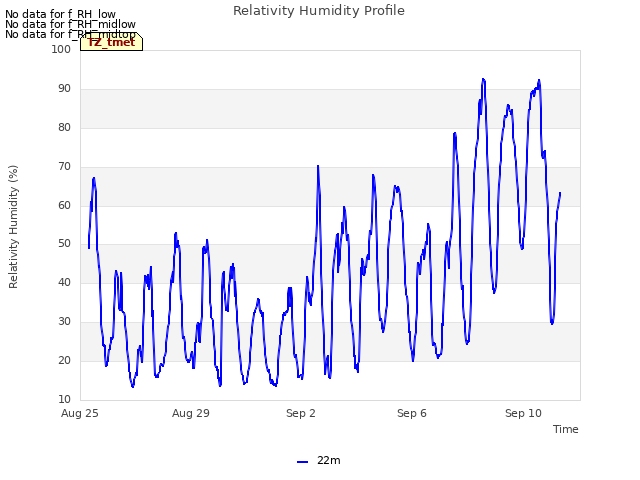
11 TZ_tmet graphs found


No data found for TZ_soilco2.
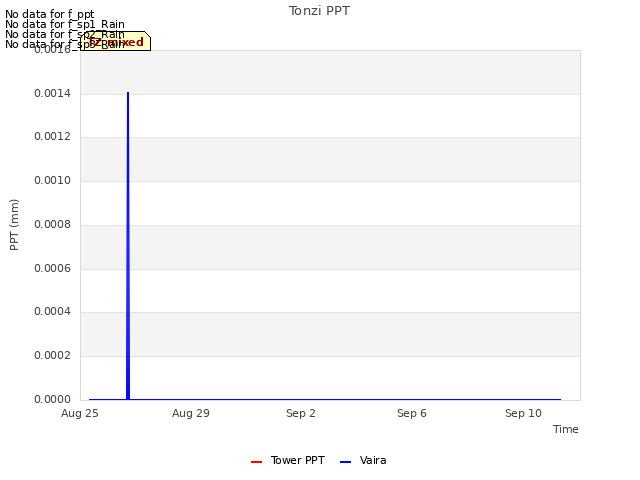
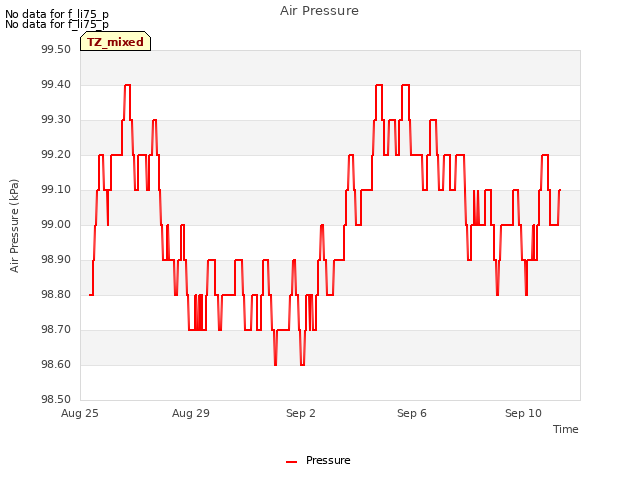
Can't check TZ_mixed
3 TZ_mixed graphs found

No data found for TZ_fflux.
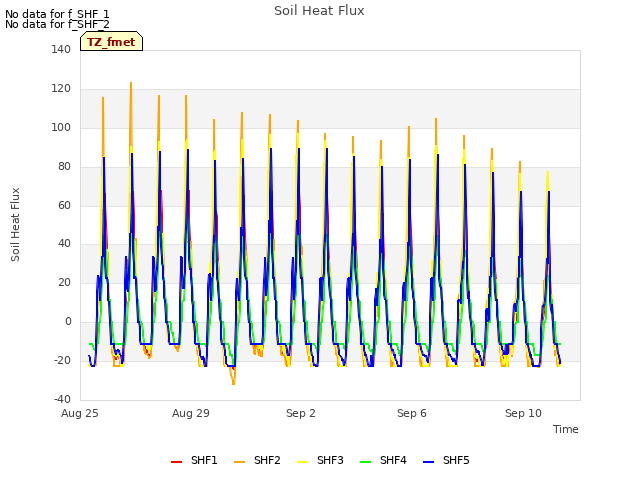
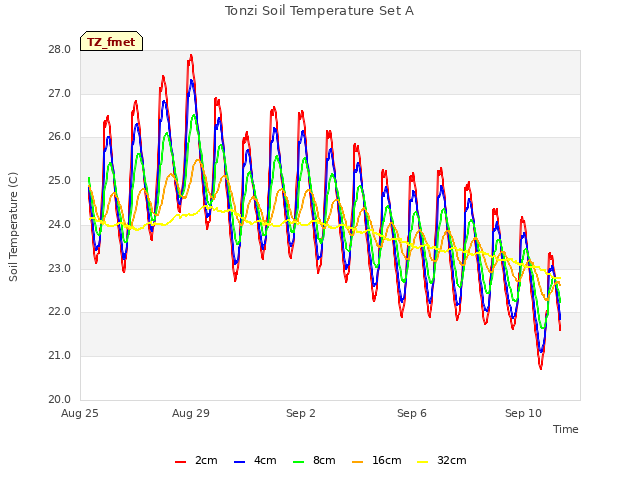
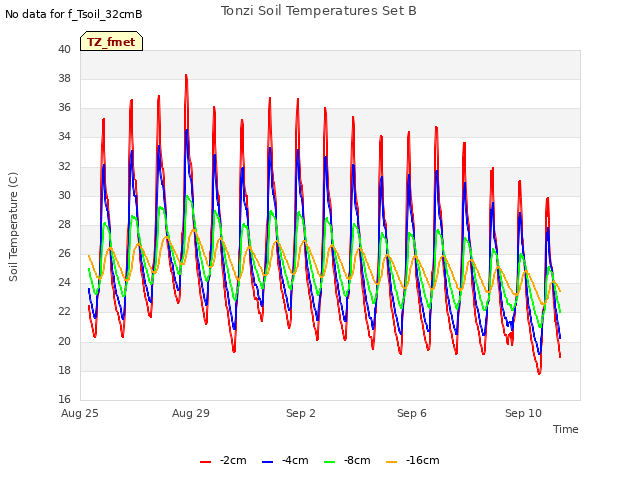
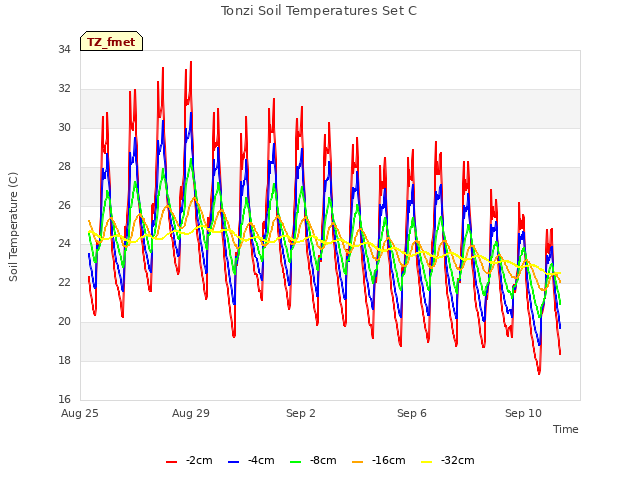
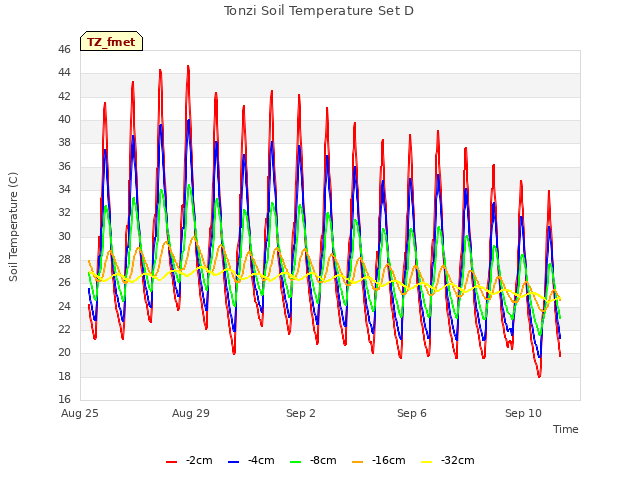
8 TZ_fmet graphs found


No data found for TZ_tram.
No data found for TZ_co2prof.
No data found for TZ_irt.
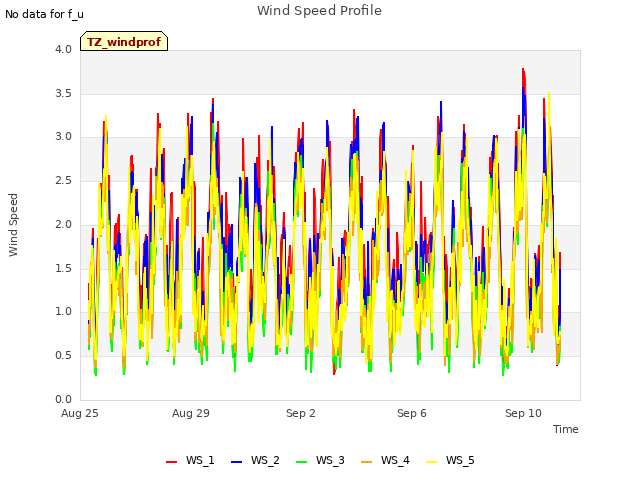
1 TZ_windprof graphs found
No data found for TZ_tflux.
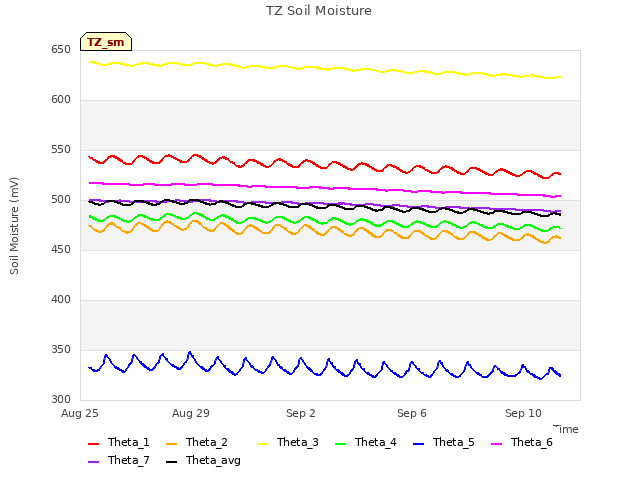
2 TZ_sm graphs found
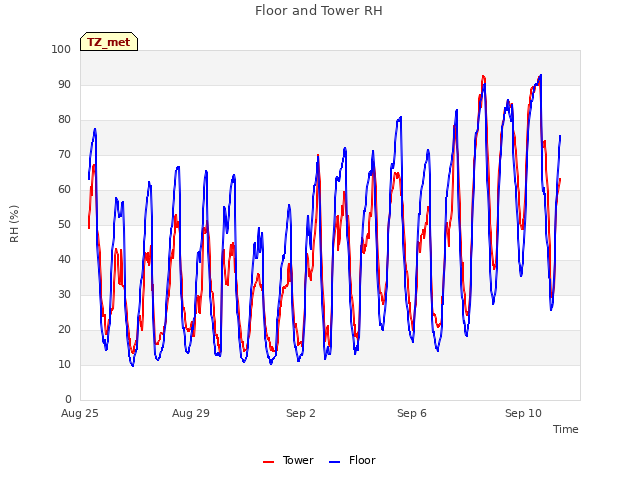
Can't check TZ_met
1 TZ_met graphs found
Can't check TZVR_mixed
No data found for TZ_osu.
No data found for TZ_fd.
Tonzi Z-cam data


