
Field Notes
<--2022-08-18 10:00:00 | 2022-08-30 09:55:00-->Other sites visited today: Hill Slough
Phenocam link: Searching...
Gilbert Tract: 2022-08-24 09:00:00 (DOY 236)
Author: Daphne Szutu
Others: Ari
Summary: ABC7 interview, moved water sensors into deeper water
| 2022-08-24 Gilbert Tract Ari and I met Katie Bandy at the gate at 9:00 PDT. Today’s visit was to participate in an ABC7 news report about wetland restoration and carbon sequestration and to extend the water sensors farther out into the water. Around 9:30 three more people started trickling in: Tim (ABC7 producer), another Tim (ABC7 drone photographer/videographer), and Sabrina (DWR public information officer). We got to the tower around 10:00 PDT, near low tide. The other 5 people started setting up their first interview with Katie which I got started servicing the tower. The met box was full of dead ants and there were a handful of live ants crawling around the box, but I could use the computer without too much of a bother. I downloaded met, cam, and USB GHG data. I changed the eddy clock +3-sec at around 9:33 PST and restarted logging. I cleaned flux and rad sensors and topped off the wash reservoir. I used canned air to spray the dead ants out and left them mothballs. After Katie’s interview about the restoration process, it was Ari’s turn to be interviewed about carbon sequestration and the teabag experiment. Afterwards Tim the producer followed Katie and Ari walking around, asking questions while filming them “in action.” Ari buried another teabag on camera which was labeled “AB7.” A UC Davis wildlife group arrived and the ABC7 and DWR groups moved on to interview them around 12:10 PDT. Ari and I continued working on site maintenance. Today we moved the water sensors farther out into the wetland so they can stay consistently submerged. Both here and at Hill Slough, out water sensors are still occasionally in the air during low tide, leading to messy data that is hard to clean. When we arrived, the eosGP was high and dry, at least 5cm above the water surface. Three of the water sensors (eosGP sn GP20200089, HYDROS21 CTD sn 1782303006, and Campbell conductivity probe sn 5688) are wired to an extension box, just a little plastic enclosure with a screw terminal. The screw terminal is connected to the main met datalogger with an extension cable. Previously, the extension cable ran from the met datalogger, along the shore, then along the boardwalk into the extension box. Today, Ari disconnected the extension cable and ran it directly from the met enclosure to the boardwalk, which let us move the extension box about 8ft (one boardwalk length) farther into the wetland. The extension cable is attached to a metal pole that I just moved from one black plastic pipe boardwalk leg to another. This gave us enough sensor cable to hang all three sensors on a fence post about 50cm beyond the end of the boardwalk. The land surface at the fence post isn't that much different than at the end of the boardwalk--maybe 5-10cm deeper but maybe it's enough. I waded around a bit and there was no obviously deeper area. When the staff gauge read 28cm at 11:50 PDT, the sensor depth was 23.5cm. All three sensors (eosGP, HYDROS21 CTD, and Campbell conductivity probe) are at the same depth. The miniDOT is still attached on a yellow plastic chain on the last post of the boardwalk. Ari will look at the data and tell me if its depth needs to be lowered. The extension box was extremely full of ants. I opened it and tried to shake as many ants out as possible before Ari brought the canned air over to spray out as many as I could. It was annoying to make wiring changes because ants would start swarming up your hands and arms as soon as you touched anything in the box. I would connect one wire and then drop it all like a hot potato to shake ants off my hands. I left them some mothballs. The bottom clasp on the extension box broke so it should be replaced before it starts raining. We looked at the data and noticed the eosGP and CTD depth data was bad. The eosGP was easy to fix—its power wires in the extension box had come out of the screw terminal, probably when I was shaking them to get rid of ants. The CTD depth was more complicated to troubleshoot. The number would slowly drift from the 200s to -100s no matter where the water sensor was in the water channel or in the air. Conductivity and temperature from the CTD looked reasonable, so this is weird because all data from this SDI-12 sensor is coming in the same wire with the same instruction. Something is probably wrong with the sensor itself, so I brought the CTD sn 1782303006 back to the lab. We left at 13:30 PDT. Looking at the data back in the lab, the CTD depth measurement started going bad around 2022-08-18. Instead of 2 daily peaks in water level, the second peak gets smaller for a few days before disappearing. |
4 photos found

20220824GT_AriInterview2.jpg ( 2022-08-24 11:15:15 ) Full size: 1920x1440
Ari explaining our instrumentation to ABC7 and how they help measure carbon sequestration.

20220824GT_KatieInterview.jpg ( 2022-08-24 10:19:19 ) Full size: 1920x1440
Katie Bandy getting interviewed by ABC7 about the Dutch Slough Restoration Project. Ari is acting as a microphone stand.

20220824GT_AriInterview.jpg ( 2022-08-24 10:46:18 ) Full size: 1440x1920
Ari getting interviewed by ABC7 about wetland restoration and carbon sequestration. She is still the microphone stand, too.
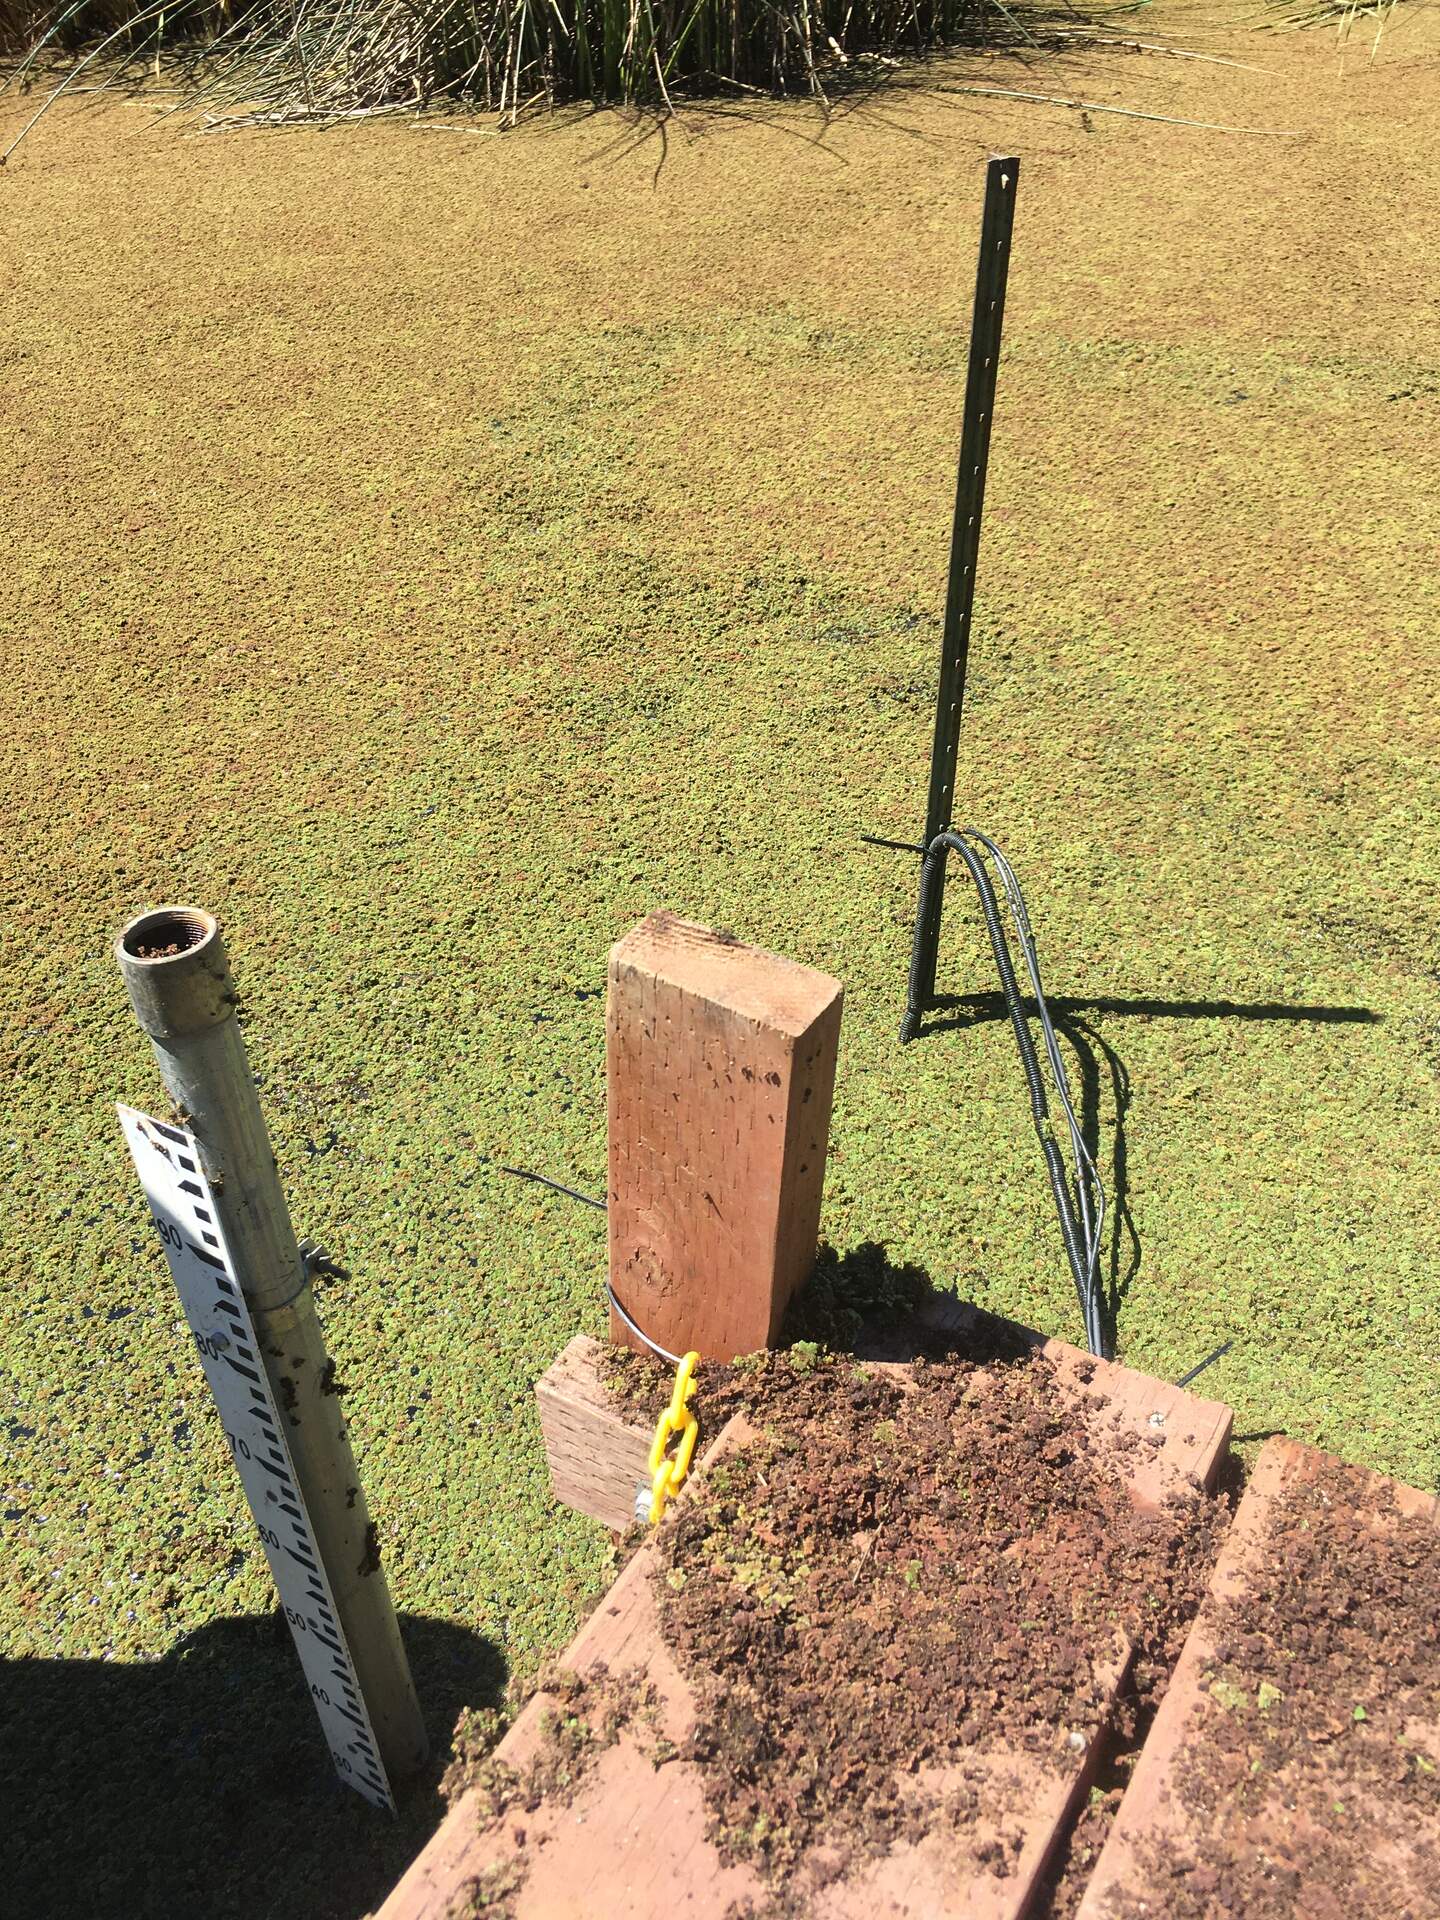
20220824GT_WaterSensors.jpg ( 2022-08-24 12:25:55 ) Full size: 1440x1920
Three water sensors (eosGP, CTD, Campbell conductivity) attached to a fence post in a slightly deeper part of the wetland. The slight disturbance in the azolla on the surface indicates where I waded around to find the deepest point of this pond.
8 sets found
Can't check MBWPEESWGT_mixed
Can't check MBEEWPSWEPGT_cam
16 GT_met graphs found
4 GT_flux graphs found
3 GT_adcp graphs found
1 GT_cam graphs found
2 GT_usgs graphs found
No data found for GT_chanexo.