
Field Notes
<--2022-04-27 16:20:00 | 2022-05-26 10:30:00-->Other sites visited today: Tonzi
Phenocam link: Searching...
Vaira: 2022-05-10 10:30:00 (DOY 130)
Author: Joe Verfaillie
Others:
Summary: Hopefully fixed the solar system that was dying over night, removed last soil co2 profile, having problems with serial port adapter.
| Vaira 2022-05-10 I arrived at about 10:30 PDT. It was sunny with a cool breeze from the west. When I arrived there were just a few white puffy clouds but more and more moved in from the west. Less flowers than last time. The grass is mostly about knee high but there are sparse patches of waist high seed stalks. The road is dry and the water level in the water hole has gone down a bit. The soil surface is dry and dusty. I measured the well and then inspected the solar power system that has been failing. When I got there the panels were providing only about 12A. I found the positive wire that connects the two banks of panels had a break that was completely corroded. There was enough length that I was able to cut off the corroded part and reattach the wire. It’s now laying on the boardwalks at the base of the panels instead of half buried in the dirt. After fixing the wire the panels were providing more than 20A. Then I load tested the batteries sn BB-VR. In disconnecting the battery leads I noticed that a positive terminal on one of the batteries was warm to the touch. That battery tested bad along with another battery in the other box. The leads to the charge controller were on the north most batteries in each box. The bad batteries were second from the north in each box. I moved the bad ones to the north most position and left them disconnected. The remaining six batteries all tested good. I reconnected them and restarted the solar power. I think the tags on these batteries say that they were new in September and October of 2005. I also removed the four remaining Eosense soil CO2 probes and the 23x sn 2299 that was collecting their data. At least two of the probes have not been collecting good CO2 data from a while, temperatures might have been okay. There was significant gopher/mouse activity around the probes. The probe that was originally at -16cm had tunnels just below it and passed its side further up. Probes Removed: 1 Originally at -2cm sn GP20170028 now at -2.5 to -6cm 2 Originally at -4cm sn GP20160042 now at -4 to -8cm 3 Originally at -8cm sn GP20160117 now at -10cm, rodent tunnels below and around this sensor 4 Originally at -16cm sn GP20160012 now at -20cm I collected the met, flux, camera and FD data. I was having trouble with the serial port adapter again and had to restart the laptop a couple of times. For the met CR1000 I ended up connecting to it over the Ethernet line. I also fixed the starDot clock which the power outages had reset. The 7500 read: 427.6ppm CO2, 241.6mmol/m3 H2O, 100.1kPa, 18.6C, 103.3SS I did spectra measurements when I arrived before the clouds moved in. And later measured the veg height. I left at about 13:00 |
Field Data
No tank data
Well Depth
| Date | Location | Depth (feet) |
|---|---|---|
| 2022-05-10 | VR_well | 54.9 |
| 2022-05-10 | TZ_floor | 24.95 |
| 2022-05-10 | TZ_tower | 38.75 |
| 2022-05-10 | TZ_road | 33.75 |
mode = both
Moisture Point Probes TZ
Array
(
[0] => Tower_1
[1] => Soil_Transect_4_1
[2] => Soil_Transect_3_1
[3] => Soil_Transect_2_1
[4] => Soil_Transect_1_1
[5] => SoilCO2_West_A_1
[6] => SoilCO2_West_C_1
[7] => Tower_2
[8] => Soil_Transect_4_2
[9] => Soil_Transect_3_2
[10] => Soil_Transect_2_2
[11] => Soil_Transect_1_2
[12] => SoilCO2_West_A_2
[13] => SoilCO2_West_C_2
[14] => Tower_3
[15] => Floor_South_3
[16] => Soil_Transect_4_3
[17] => Soil_Transect_3_3
[18] => Soil_Transect_2_3
[19] => Soil_Transect_1_3
[20] => SoilCO2_West_A_3
[21] => SoilCO2_West_C_3
[22] => Tower_4
[23] => Floor_South_4
[24] => Soil_Transect_4_4
[25] => Soil_Transect_3_4
[26] => Soil_Transect_2_4
[27] => Soil_Transect_1_4
[28] => SoilCO2_West_A_4
[29] => SoilCO2_West_C_4
)
| Date | DOY | Rep | Depth | Tower_1 |
Soil_Transect_4_1 |
Soil_Transect_3_1 |
Soil_Transect_2_1 |
Soil_Transect_1_1 |
SoilCO2_West_A_1 |
SoilCO2_West_C_1 |
Tower_2 |
Soil_Transect_4_2 |
Soil_Transect_3_2 |
Soil_Transect_2_2 |
Soil_Transect_1_2 |
SoilCO2_West_A_2 |
SoilCO2_West_C_2 |
Tower_3 |
Floor_South_3 |
Soil_Transect_4_3 |
Soil_Transect_3_3 |
Soil_Transect_2_3 |
Soil_Transect_1_3 |
SoilCO2_West_A_3 |
SoilCO2_West_C_3 |
Tower_4 |
Floor_South_4 |
Soil_Transect_4_4 |
Soil_Transect_3_4 |
Soil_Transect_2_4 |
Soil_Transect_1_4 |
SoilCO2_West_A_4 |
SoilCO2_West_C_4 |
Avg | Spacial Count |
Measurement Count |
|---|---|---|---|---|---|---|---|---|---|---|---|---|---|---|---|---|---|---|---|---|---|---|---|---|---|---|---|---|---|---|---|---|---|---|---|---|
| 2022-05-10 | 130 | 0 | nan | 8.3 | 5.4 | 3.6 | 7.7 | 2.1 | 14.7 | 7.1 | 14.5 | 5.7 | 16.1 | 17 | 5.4 | 18.5 | 15.8 | 16.5 | 20.4 | 11.5 | 15.1 | 22.1 | 15.9 | 22.9 | 13.4 | 23.9 | 16.5 | 14.2 | 22.5 | 34 | 16.8 | 19.6 | 21.9 | |||
| 2022-05-10 | 130 | 1 | nan | 8.3 | 2.8 | 3.3 | 8.3 | 2.1 | 16.5 | 7.1 | 14.5 | 4.5 | 16.1 | 16.7 | 5.7 | 13 | 16.1 | 18.2 | 20.1 | 12.3 | 14.8 | 20.4 | 15.9 | 19.3 | 13.1 | 24.5 | 16.2 | 13.9 | 22.8 | 33.7 | 16.8 | 22.5 | 18.8 | |||
| 2022-05-10 | 130 | Avg | 0-15cm | 0 | 0 | |||||||||||||||||||||||||||||||
| 2022-05-10 | 130 | Avg | 15-30cm | 0 | 0 | |||||||||||||||||||||||||||||||
| 2022-05-10 | 130 | Avg | 30-45cm | 0 | 0 | |||||||||||||||||||||||||||||||
| 2022-05-10 | 130 | Avg | 45-60cm | 0 | 0 |
No VR Moisture Point data found
No TZ grass heigth found
Grass Height VR 15
| Date | Height reps (cm) | Location | Average | Samp | STDEV | ||||||||||||||
|---|---|---|---|---|---|---|---|---|---|---|---|---|---|---|---|---|---|---|---|
| 2022-05-10 | 38 | 22 | 35 | 120 | 45 | 46 | 40 | 38 | 46 | 36 | 60 | 35 | 120 | 45 | 26 | GH_ALL | 50.13 | 15 | 28.72 |
No VR Tree DBH found
No water potential data found
No VR Grass Biomass data found
No VR OakLeaves Biomass data found
No VR PineNeedles Biomass data found
1 photos found
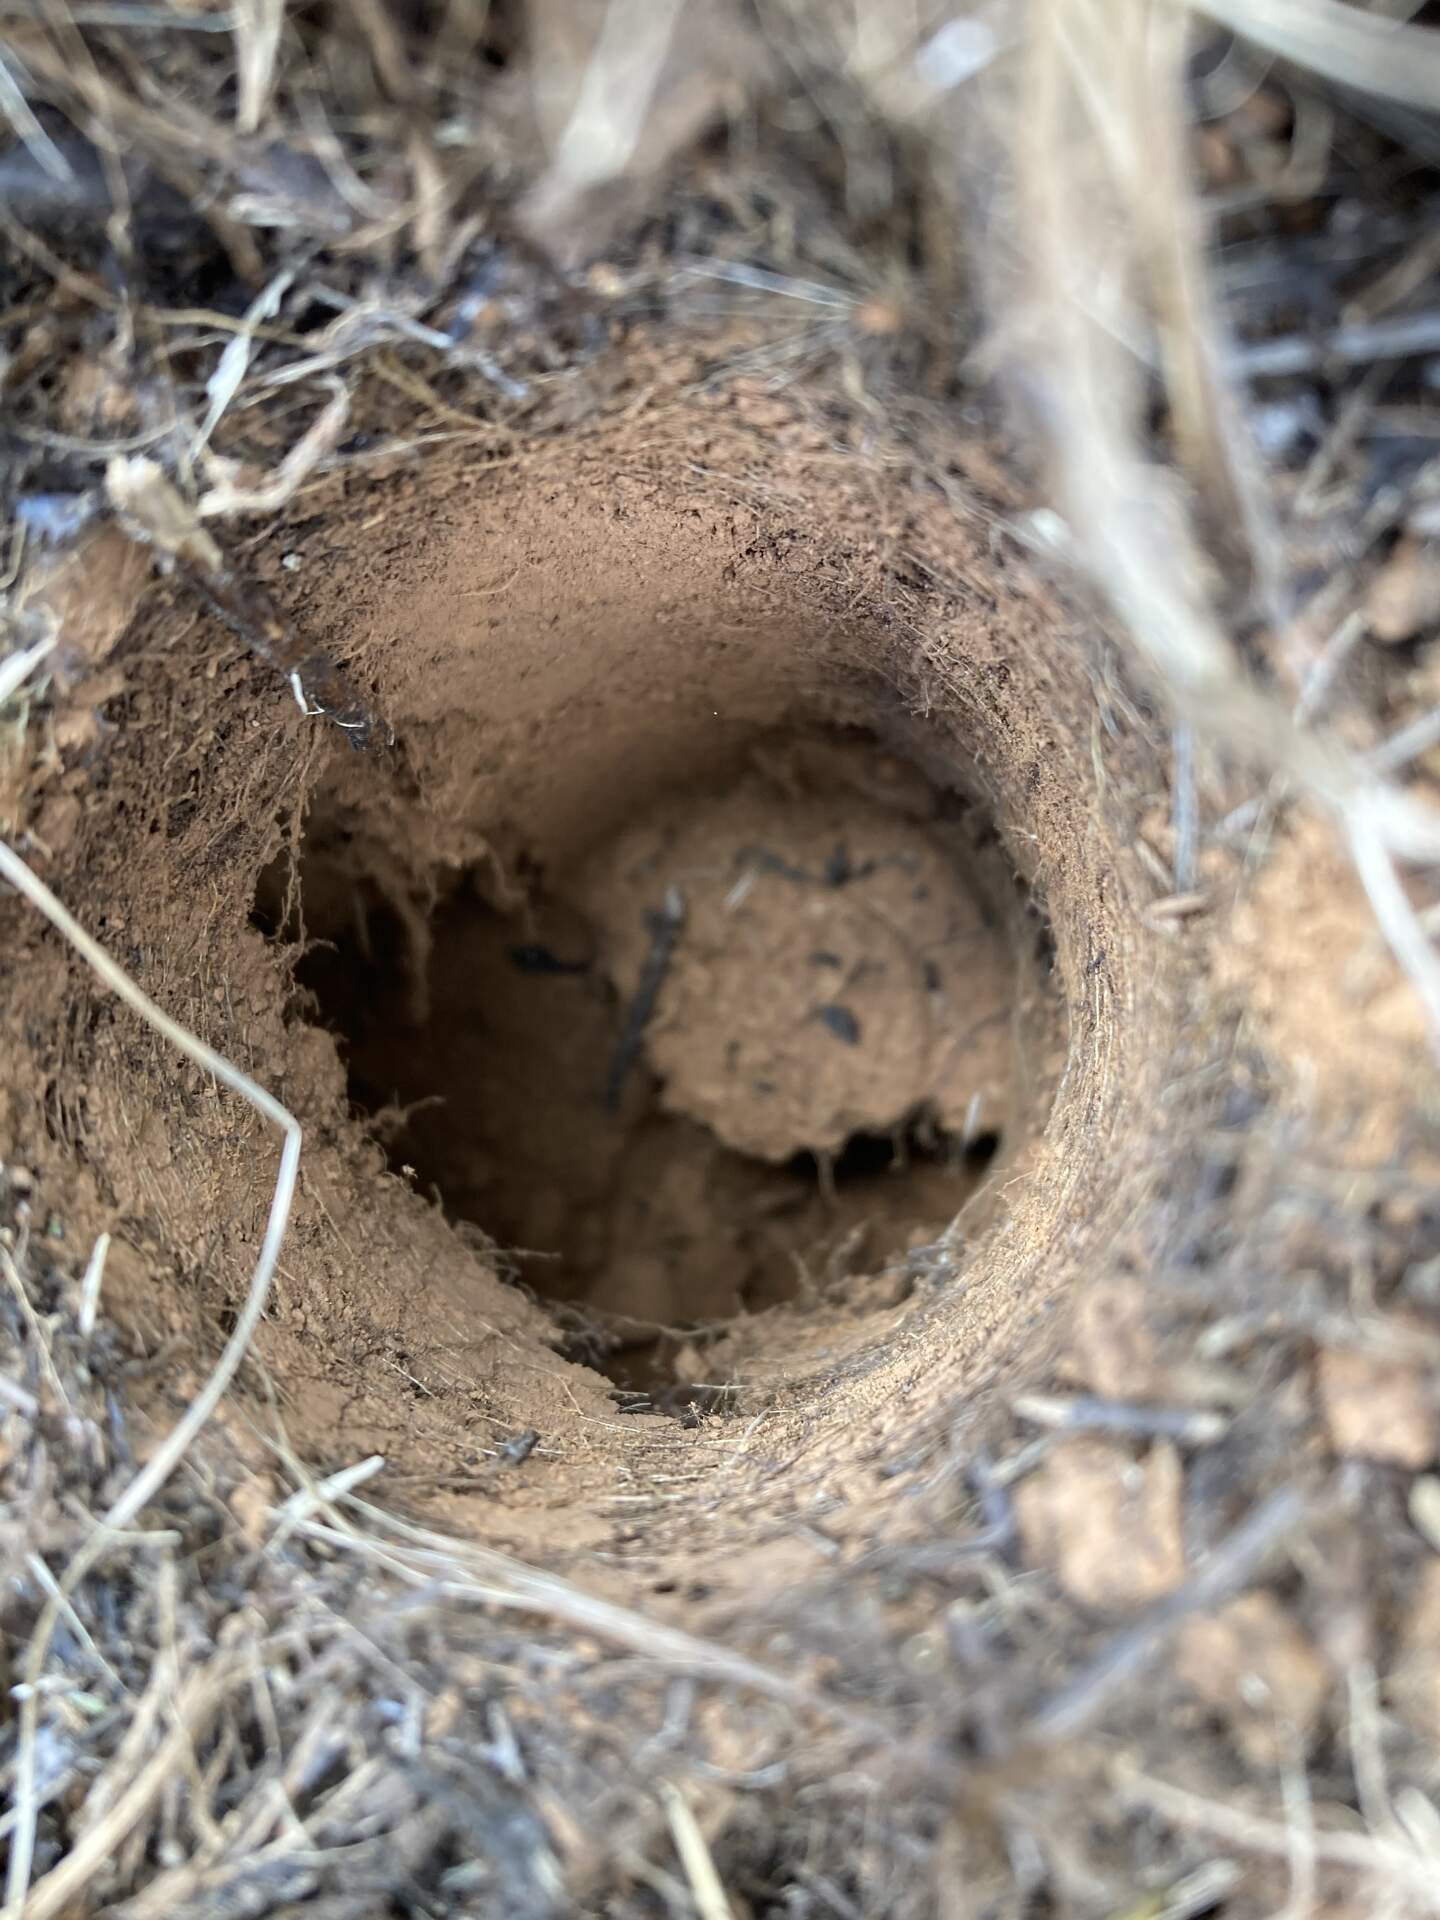
20220510VR_RodentTunnel.jpg ( 2022-05-10 11:57:08 ) Full size: 1440x1920
A large rodent tunnel next to soil co2 probe
9 sets found
16 VR_met graphs found
2 VR_flux graphs found
2 VR_soilco2 graphs found
2 VR_pond graphs found
Can't check TZVR_mixed
3 VR_fd graphs found
4 VR_processed graphs found
4 VR_arable graphs found
No data found for VR_soilvue.