Field Notes
<--2021-12-14 12:15:00 | 2022-01-20 12:30:00-->Other sites visited today: Gilbert Tract | Mayberry | West Pond | East End | Bouldin Alfalfa
Phenocam link: Searching...
Bouldin Corn: 2022-01-02 16:25:00 (DOY 2)
Author: Daphne Szutu
Others: Mike
Summary: Regular data collection/cleaning, drove back way from alfalfa, field is flooded, removed eosFD for testing after being submerged, power outage for about 1 day, confirmed padlock combo for red gate
| 2022-01-02 Bouldin Corn Mike and I arrived at 16:25 PST after driving through the muddy back way from Bouldin Alfalfa. I had planned to stop here at corn first and was planning to take Joe’s secret way in (2nd turnoff after the overpass to avoid the red gate), but I hadn’t taken it before and I missed the sharp turnoff from Highway 12. The back roads were muddy but we splattered through in my car without 4WD. I would probably try to avoid this road in the future, though, especially without 4WD. It was cold, partly cloudy, and the sun was setting, making for a nice reflection on the mostly still water. We could hear the sounds of hunting, but not too close to us. Lots of geese and other waterfowl in the water and in the sky. Our field and the field to the south was flooded, but the fields to the north and east were mostly dry. From the phenocam photos, looked like puddles started forming on 2021-12-24 and our field was completely flooded on 2021-12-25. Tyler was here a few days ago on 2021-12-29 and found the eosFD was 2/3 submerged. He removed it from its tiedowns and placed it on the lower boardwalk. I unplugged its cable, coiled the cable up on the tower, and disconnected the power from inside the datalogger enclosure. I brought the FD chamber sn FD20180067 back to the lab to download its data and test in the lab after its bath. I downloaded met, camera, and USB GHG data. There was a power outage for about 1 day where we are missing all data. I downloaded the PA data, power cycled it, and watched the card slot LEDs blink appropriately. I downloaded the IRT data by swapping the microSD card and using CardConvert to convert the fast data to TOB1 and the slow data to TOA5. I cleaned the flux and rad sensors and refilled the wash reservoir, which had been ½ full. LI-7500 readings: CO2 438ppm H2O 356ppm T 8.3C P 102.3kPa SS 102 --> 102 after cleaning LI7700 readings: CH4 2.6ppm RSSI 50 --> 79 after cleaning We left at 13:55 PST. The red gate was actually open and the padlock code was the same as the one we used on the digital keypad before. You just have to make sure you line up the code with the faded black line, not with the middle seam (this was my mistake last time). |
2 photos found

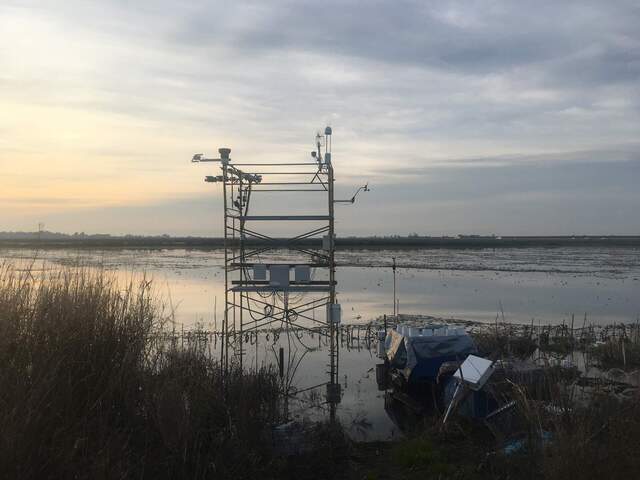
20220102BC_FloodedField.jpg ( 2022-01-02 16:24:41 ) Full size: 1920x1440
Flooded field at BC. Power post has fallen down in the lower right hand corner of the photo.

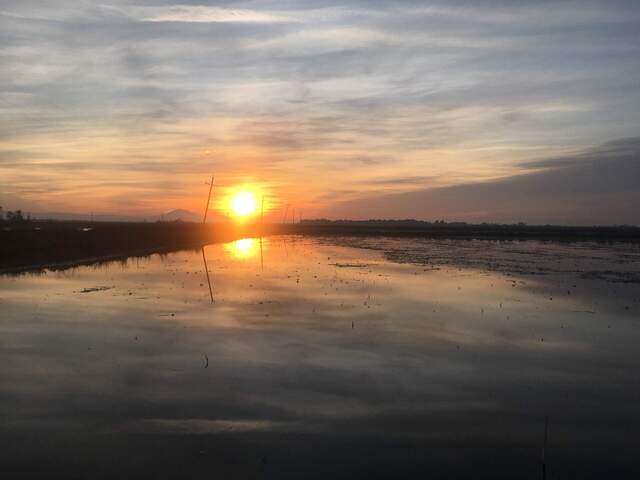
20220102BC_Sunset.jpg ( 2022-01-02 16:46:14 ) Full size: 1920x1440
Winter sunset reflected in flooded field at BC
6 sets found
17 BC_met graphs found
5 BC_flux graphs found
Can't check TATWBABCSB_cam
Can't check MBSWEEWPBCBA
2 BC_pa graphs found
1 BC_arable graphs found

