Field Notes
<--2021-10-07 07:45:00 | 2021-11-05 16:40:00-->Other sites visited today: Mayberry | West Pond | East End | Bouldin Corn | Bouldin Alfalfa
Phenocam link: Searching...
Gilbert Tract: 2021-10-21 10:30:00 (DOY 294)
Author: Daphne Szutu
Others: Joe, Francisco
Summary: Regular data collection/cleaning, journalist visit, renamed camera file names (again), removed radiometer cal kit, first substantial rain of the season earlier this week and more rain this weekend
| 2021-10-21 Gilbert Tract After a rough start in the morning with rain delays and forgetting my driver’s license at home (and the rental truck tire needing more air), Joe and I arrived at Gilbert Tract at 10:30 PDT. It was cool, overcast, and drizzly. It has been lightly raining on and off over the past few days; this weekend we are will have an atmospheric river with an expected 12-20 cm rain, wow! We met our visitor for the day, Francisco, a Cal journalism student who is working on an article about wetlands and carbon sequestration for Bay Nature magazine. He parked his motorcycle in the barn by the entrance and rode in the back of the truck to our tower. It has been lightly raining over the past few days, and there was still a light drizzle while we were on site. It looked like low tide when we arrived. The water level was low enough that the ground around the well was exposed, so the eosGP and conductivity sensor were in the air. Joe gave an intro to Francisco while I worked on downloading data. I downloaded met, cam and USG GHG data. The phenocam file names had reverted back to “siwetland†again, so I changed the name through Stardot tools by editing the config files, “ftp.scr†and “IR_ftp.scrâ€. This time I double checked that I saved each config file, as well as save all configuration changes (separate button below the list of configuration files). I changed the eddy clock +2min. I cleaned flux and rad sensors. They were pretty wet from all the rain and the 7500 had a SS of 0. After cleaning, the SS was 108, which I reset back to 100. I had to clean the sensors again at the end of the visit because all the climbing up/down the scaffolding shook more water loose from the top of the sensor that fell onto the sensors’ lower lenses. We topped off the wash reservoir. I accidentally jerked the eddy post around when I climbed up to clean the sensors. Joe fixed it so the sonic orientation was back to 76 deg true N and tightened the clamps. He may put in new clamps another time because these were loose. We downloaded the rad cal kit data and removed the cal sensors to put up at Bouldin Alfalfa later in the day. Sensors removed: CR1000 sn 23865 CNR4 sn 121038 PAR sn 060831 NDVI in sn 1049 NDVI out sn 1050 Joe walked out into the wetland to see how long a boardwalk needs to be for us to keep water sensors submerged during low tide. He decided about 6m and will check in with Katie about the boardwalk design. LI-7500 readings: CO2 *ppm (too wet to read) --> forgot to check after cleaning H2O *ppm (too wet to read) --> forgot to check after cleaning T 17.3C P 101.9kPa SS 0--> 108 after cleaning --> reset SS of sn 0065 to 100 LI7700 readings: CH4 2.4ppm RSSI46--> 81 after cleaning We left at 11:35 PDT. |
3 photos found

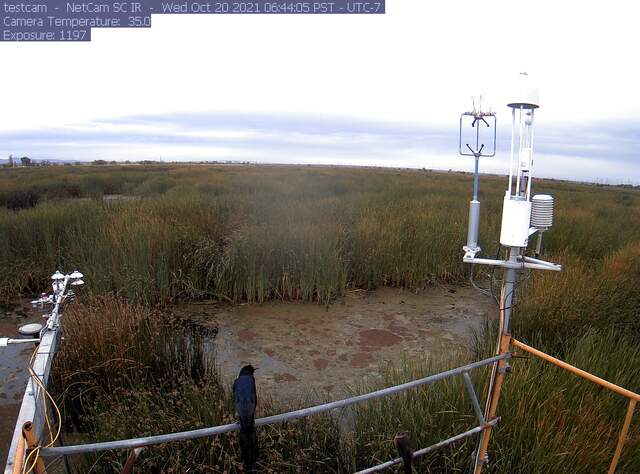
gilberttract_2021_10_20_064405.jpg ( 2021-10-20 06:46:02 ) Full size: 1296x960
Grackle on railing

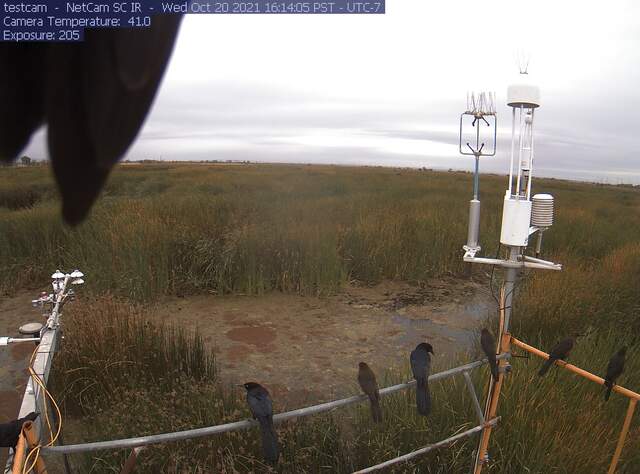
gilberttract_2021_10_20_161405.jpg ( 2021-10-20 16:15:52 ) Full size: 1296x960
Lots of Grackles

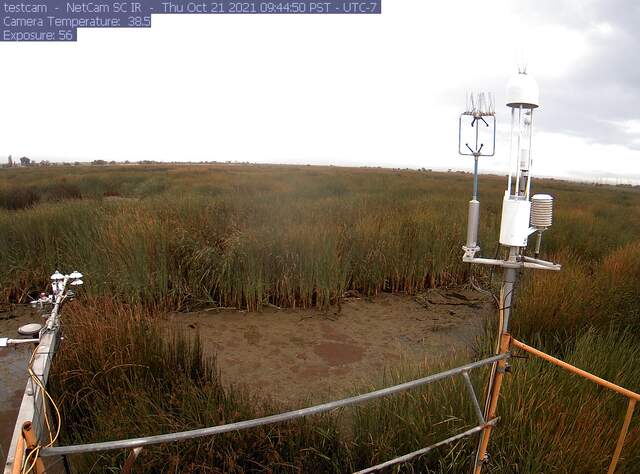
gilberttract_2021_10_21_094450.jpg ( 2021-10-21 10:45:48 ) Full size: 1296x960
Lowish tide
8 sets found
Can't check MBWPEESWGT_mixed
Can't check MBEEWPSWEPGT_cam
16 GT_met graphs found
4 GT_flux graphs found
No data found for GT_adcp.
1 GT_cam graphs found
2 GT_usgs graphs found
2 GT_chanexo graphs found

