
Field Notes
<--2021-10-21 15:30:00 | 2021-11-18 13:55:00-->Other sites visited today: Hill Slough | West Pond | Mayberry
Phenocam link: Searching...
East End: 2021-11-04 12:30:00 (DOY 308)
Author: Joe Verfaillie
Others: Daphne, Robert, Vona
Summary: Cattails turning yellow/brown, tipping bucket tested good, cleaned spider web out of pi-cam window
| East End 2021-11-04 Daphne, Robert, Vona and I arrived at about 12:30. We stopped for lunch on the levee above the pump station. They were working on the pump station and turned on one of the pumps while we were there. The river seemed to be flowing backwards as the tide came in. It was mild and partly overcast with a nice breeze. There was an interesting collection of poop on the boardwalk, lots of seed, lots of crayfish, and just black. Also a big praying mantis – about 6in long. Water level was 35cm. The cattails are turning yellow/brown. We tested the tipping bucket. We got 50/50 tips; all is well after last visit’s adjustment. Daphne collected flux, met and camera images. The 7500 read: 414ppm CO2, 610mmol/m3 H2O, 20.6C, 102kPa, 102SS after cleaning The 7700 read: 1.99, 83RSSI after cleaning Robert cleaned the instruments and we're pretty sure we topped up the wash reservoir. I opened up the pi-cam box and unfastened the camera so that I could clean a spider web out of the little gap between the lens and the glass window. It seemed to go okay and I didn’t have the cycle power on the Pi. We left at about 13:00 PDT |
1 photos found
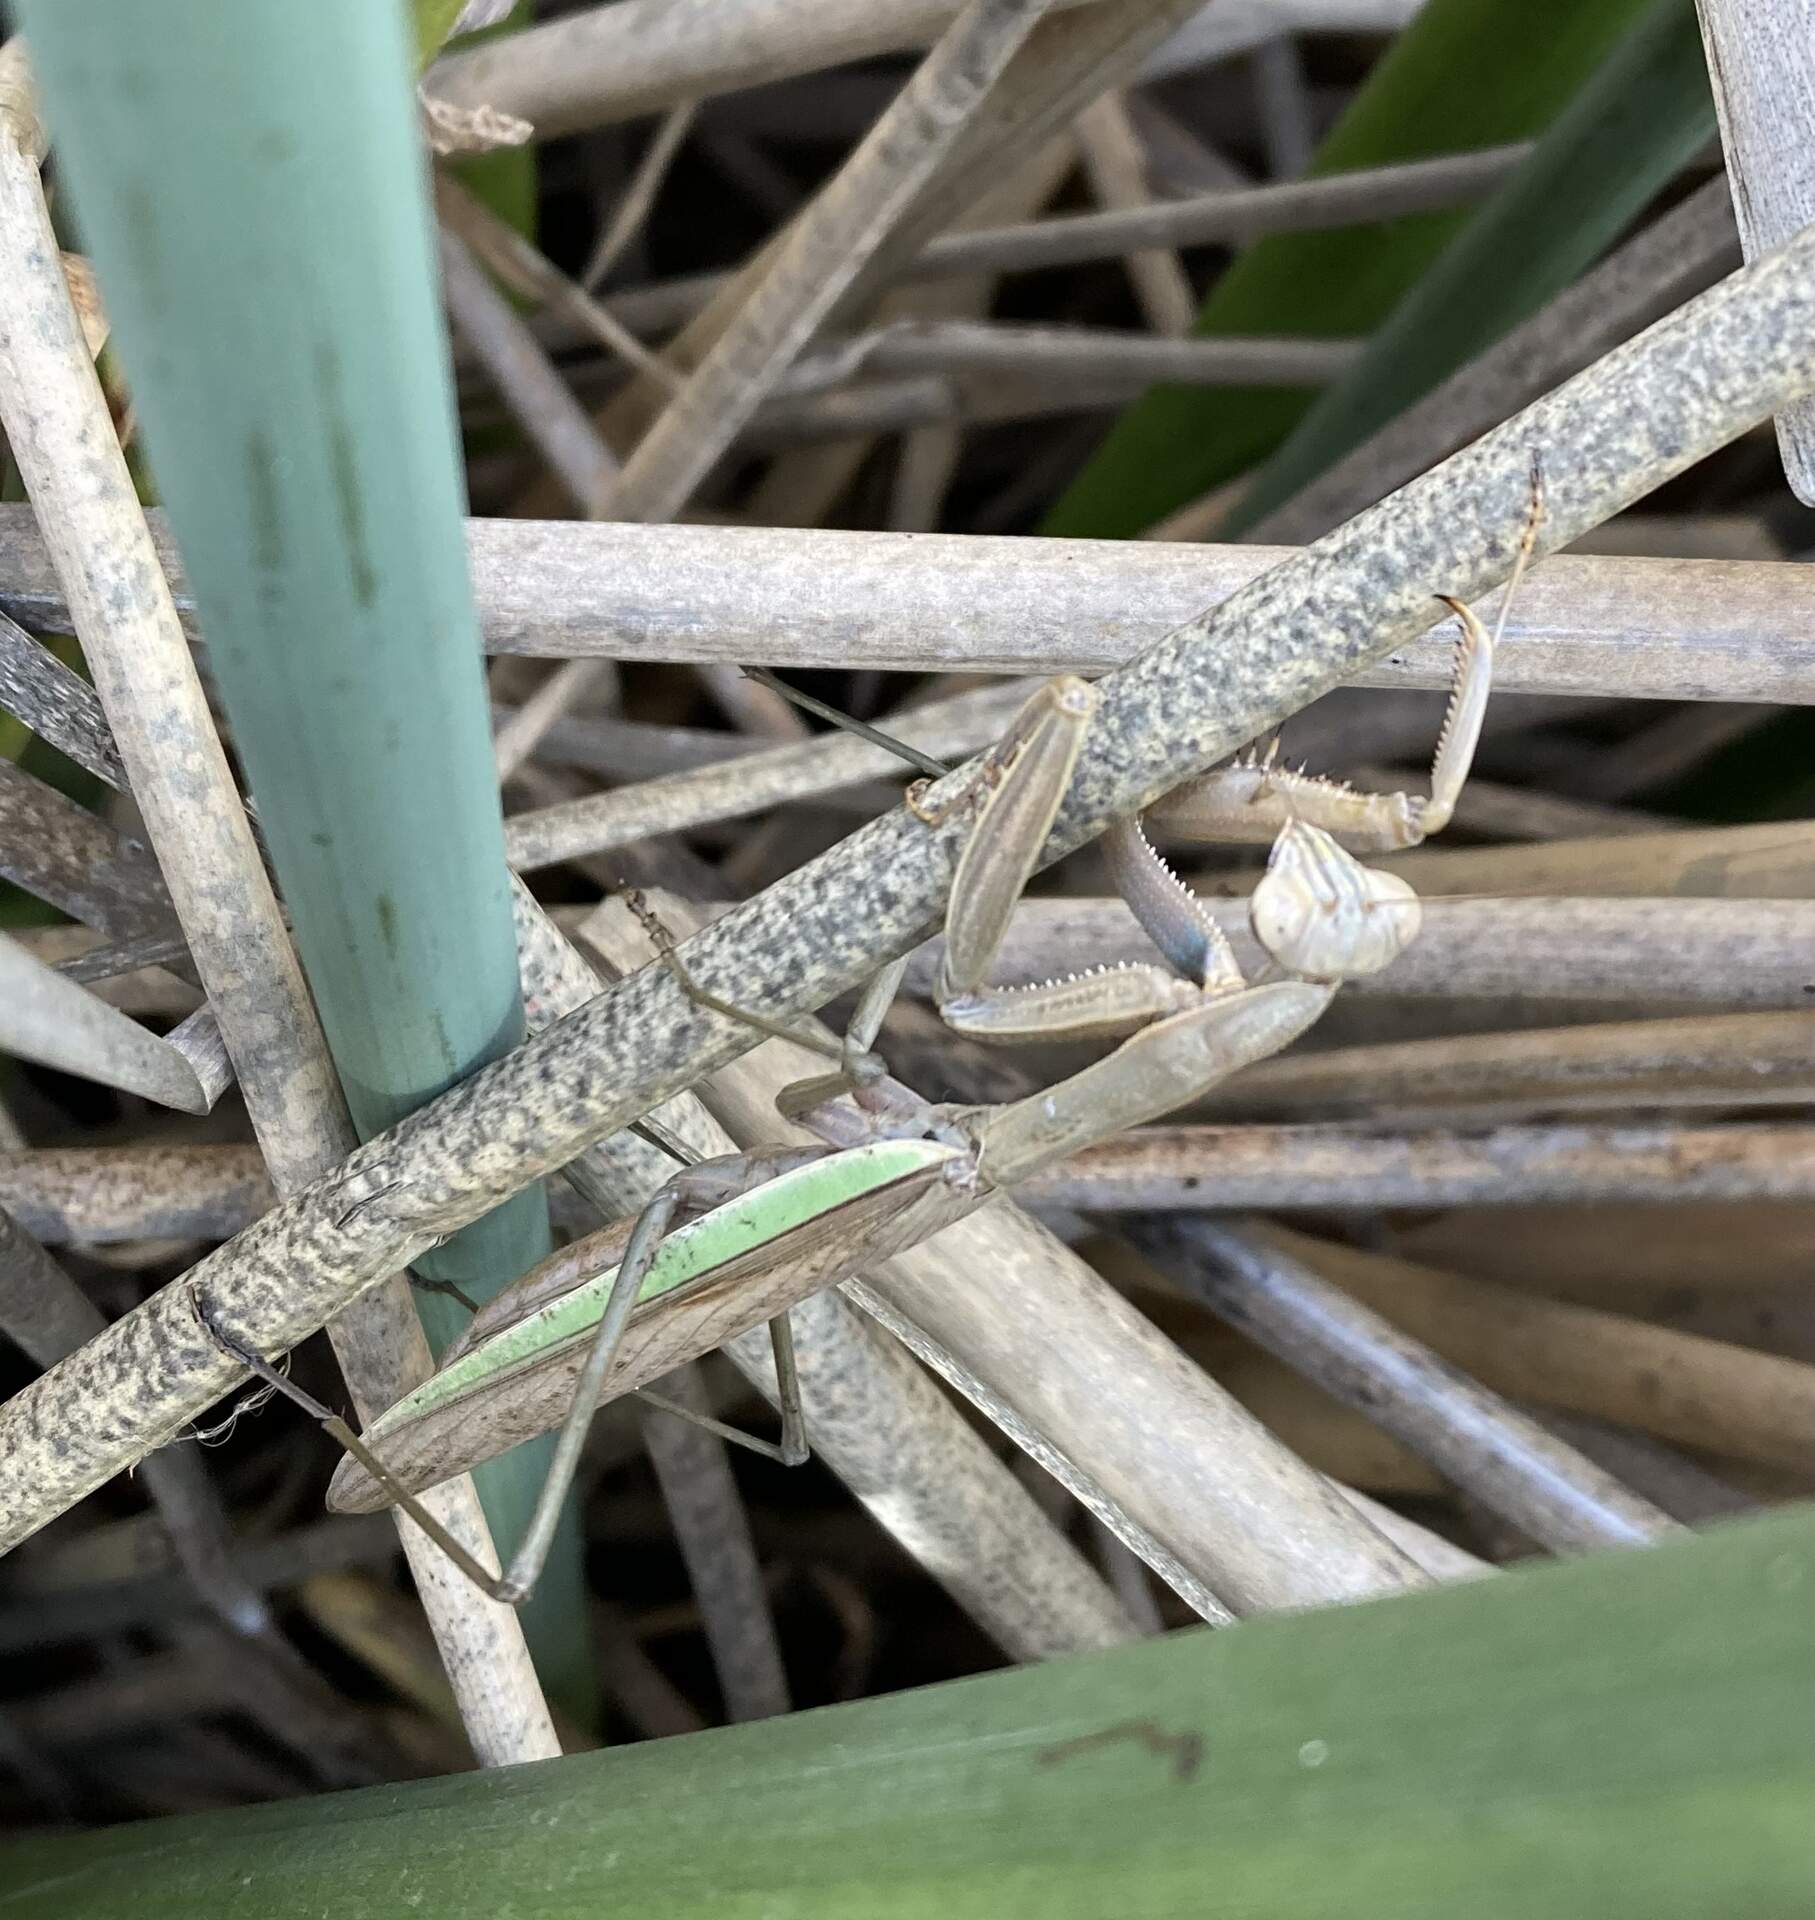
20211104EE_PrayingMantis.jpg ( 2021-11-04 12:27:42 ) Full size: 1815x1920
A praying mantis about the length of my hand
11 sets found
14 EE_met graphs found
Can't check EE_mixed
1 EE_mixed graphs found
8 EE_flux graphs found
Can't check MBWPEESWGT_mixed
1 EE_cam graphs found
Can't check MBEEWPSWEPGT_cam
Can't check SIMBTWEE_met
Can't check EE_Temp
5 EE_Temp graphs found
Can't check EE_minidot
1 EE_minidot graphs found
Can't check MBSWEEWPBCBA
1 EE_processed graphs found