Field Notes
<--2021-10-26 09:30:00 | 2021-11-05 00:00:00-->Other sites visited today: West Pond | East End | Mayberry
Phenocam link: Searching...
Hill Slough: 2021-11-04 09:45:00 (DOY 308)
Author: Joe Verfaillie
Others: Daphne, Robert, Vona
Summary: Lowish tide, excavators still working on breach I think, tested tipping bucket, added MiniDot, added Eos CO2 probe, 7700 thermocouple broken, WD-40'd the locks, found some biofilms.
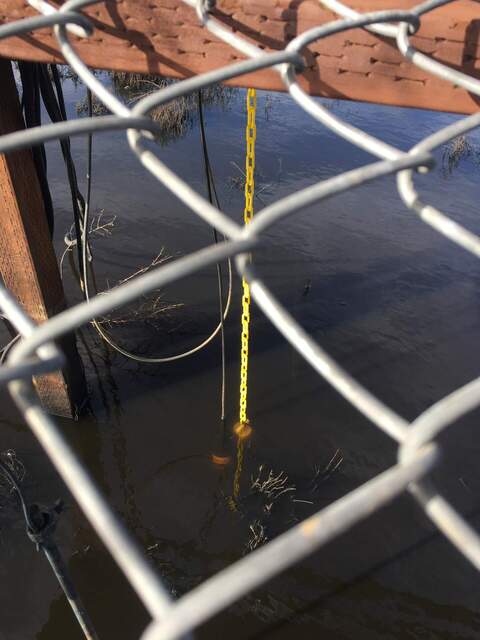
| Hill Slough 2021-11-04 Daphne, Robert, Vona and I arrived at 9:45 PDT. It was mild with a light breeze and partly overcast. The water was much lower than last time I was here. I think low tide was around 8:30 PST this morning. At 9:30 PST the tide level was about 3.39ft. The staff gauge read 4.46ft at 8:51 PST. There were a couple of excavators busy to the WNW still. We tested the tipping bucket sn 48130-611 again. The cable needs a quick plug. Last time I turned the screws too far so I turned the back in (CW) 1/2 turn before the test. We got 51/50 tips but initially read it wrong and thought it was 52. I turned the screws back out (CCW) 1/2 turn but then realized the mistake and turned the back in (CW) 1/2 turn. So rain from 10/26 to 11/4 might have been a little low. But now the bucket should be fine and does not need to be retested until next year. Daphne collected flux, met and cam data. No FD here until the breach work is finished and the water level cycle settles down. The 7500 read: 418ppm CO2, 640mmol/m3 H2O, 16.9C, 102.4kPa, 98.6SS – 100 after cleaning The 7700 read: ??ppm CH4, 40RSSI – 72 after cleaning. The wash reservoir was nearly full – topped up. Robert cleaned all the sensors. The tubing protecting the 7700 thermocouple was brittle and broke off and killed the thermocouple too. So no ppm reading from the 7700 – mmol/m3 CH4 density is okay – but the TC needs replacing. I tightened the nuts on the radiometer boom pivot bolt. It’s better but keep an eye on it. The water level desiccant was swapped. We added a miniDot DO sensor sn 931528 on a chain near the SW corner of the platform. The top of the miniDot was just below the water surface and the sensor window was probably about 10cm off the ground. This miniDot likely has “gently used†batteries. I suggest carrying some spare AA’s and swap them when they die. We added an EOS CO2 probe sn GP20160127 to the SW corner of the platform next to the miniDot. It floats with the sensor window about 10cm below the water surface. There is enough slack in the cable to let it go down a bit more with a lower tide. Hard to say where it will be a higher tides. CO2 was reading 3200mV and Temp was 2900mV but I huffed on it before putting it in the water to test it. I sprayed WD-40 on both locks and they worked much more smoothly. Vona found some biofilms, got some spectra of them and took some home to cultivate. We left at about 10:45 PDT. |
4 photos found

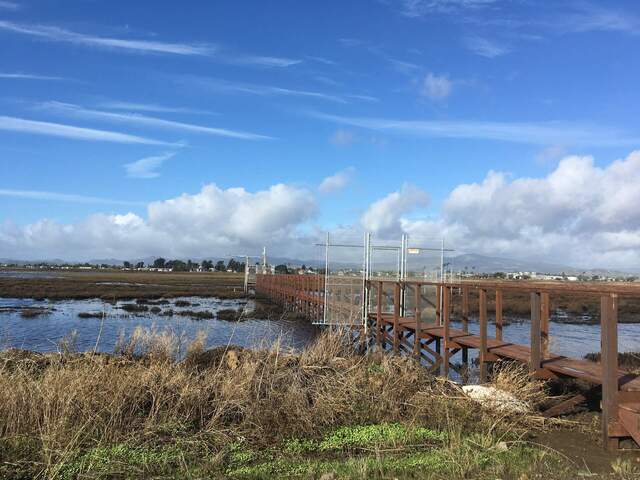
20211104HS_HighTide.jpg ( 2021-11-04 10:47:36 ) Full size: 1920x1440
Hill Slough site near high tide

20211104HS_WaterSensors.jpg ( 2021-11-04 10:34:38 ) Full size: 1440x1920
Dissolved CO2 sensor (eosGP) and miniDOT sensor deployed under the boardwalk at Hill Slough

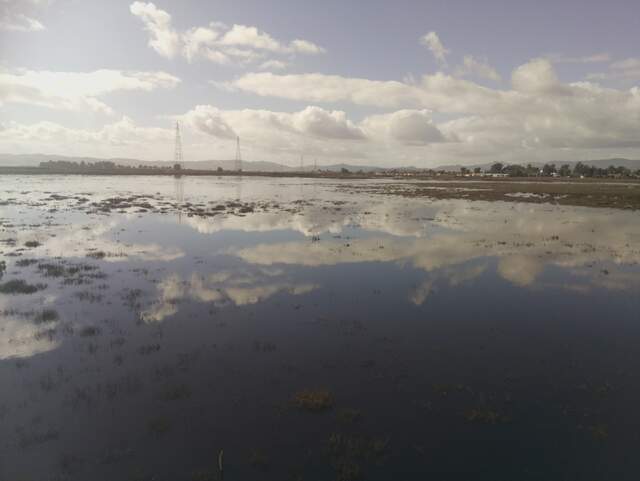
HS_picam_20211104_1215.jpg ( 2021-11-04 12:15:05 ) Full size: 1917x1440
Clouds reflected in the water

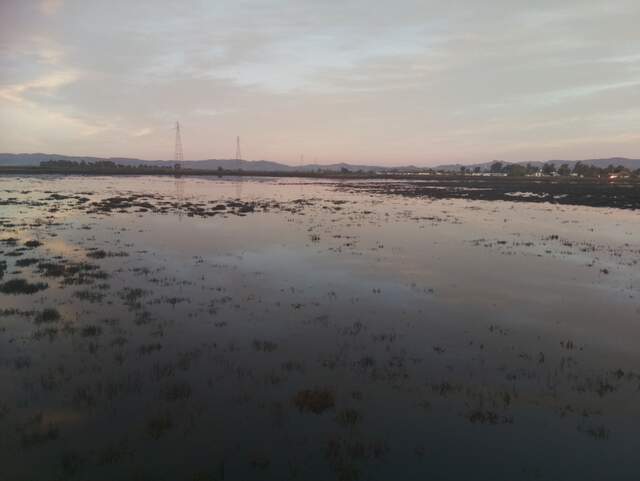
HS_picam_20211105_0645.jpg ( 2021-11-05 06:45:05 ) Full size: 1917x1440
Dawn at mid tide
4 sets found
21 HS_met graphs found
4 HS_flux graphs found
1 HS_cam graphs found
Can't check HS_Processed
2 HS_Processed graphs found

