Field Notes

<--2021-10-21 14:45:00 | 2021-11-18 13:30:00-->
Other sites visited today: Hill Slough | East End | Mayberry
Phenocam link: Searching...

West Pond: 2021-11-04 11:30:00 (DOY 308)
Author: Joe Verfaillie
Others: Daphne, Robert, Vona

Summary: Standard data collection, still no water, more willow trees trimmed.

West Pond
2021-11-04

Daphne, Robert, Vona and I arrived at about 11:30 PDT. It was mild and overcast with little to no wind. The cattails are turning yellow/brown. No water running and no water to be found in the wetland. There was a bunch of rodent poop on the lower boardwalk. The willow trees along the levees have been haphazardly pruned.

Daphne collected flux, met and camera images.
The 7500 read: 402ppm CO2, 670mmol/m3 H2O, 19.9C, 102.2kPa, 99SS – 101 after cleaning
The 7700 read: 2.06ppm CO2, 47RSSI – 81 after cleaning.
Robert cleaned all the instruments. The wash reservoir was 10% low – refilled.

We left at about 12:00 PDT

1 photos found

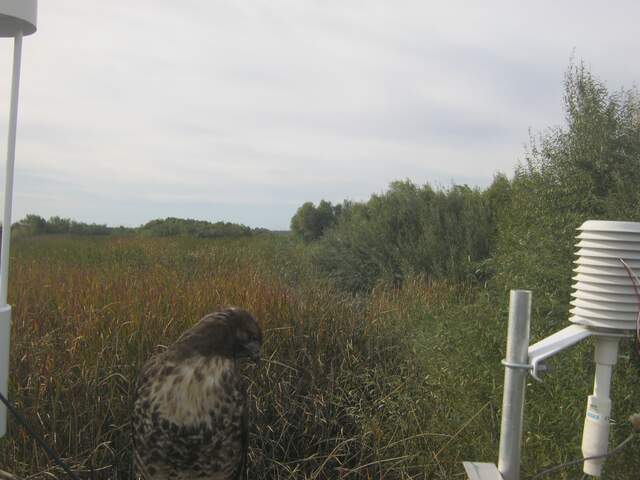
Hawk doing blue steel
WP_autocam_20211105_1415.jpg ( 2021-11-05 14:15:01 ) Full size: 1920x1440
Hawk doing blue steel

Graphs display:
8 sets found

Can't check WP_DO
1 WP_DO graphs found

Explore the graph:WestPond DO in a new window

14 WP_met graphs found

Explore the graph:Battery in a new window

Explore the graph:Temperatures in a new window

Explore the graph:Solar Radiation in a new window

Explore the graph:RH and Pressure in a new window

Explore the graph:Water Level and Precipitation in a new window

Explore the graph:Conductivity in a new window

Explore the graph:Temperatures Set A in a new window

Explore the graph:Temperatures Set B in a new window

Explore the graph:Temperature Set C in a new window

Explore the graph:Water CO2 and Temp in a new window

Explore the graph:West Pond Water CO2 in a new window

Explore the graph:WP miniDOT Dissolved Oxygen in a new window

Explore the graph:SRS NDVI Channels in a new window

Explore the graph:NDVI in a new window

5 WP_flux graphs found

Explore the graph:Winds in a new window

Explore the graph:LI7500 CO2 and H2O in a new window

Explore the graph:LI7700 CH4 and RSSI in a new window

Explore the graph:West Pond Flux Data Counts in a new window

Explore the graph:Air Temperatures in a new window

Can't check MBWPEESWGT_mixed
Can't check MBEEWPSWEPGT_cam
Can't check MBSWEEWPBCBA
1 WP_processed graphs found

Explore the graph:WP CO2 Fluxes in a new window

4 WP_arable graphs found

Explore the graph:Incoming Solar Bands in a new window

Explore the graph:Reflected Solar Bands in a new window

Explore the graph:Solar Radiation in a new window

Explore the graph:Temperatures in a new window