
Field Notes
<--2021-09-23 09:30:00 | 2021-10-21 17:20:00-->Other sites visited today: Gilbert Tract | Mayberry | West Pond | East End | Bouldin Corn
Phenocam link: Searching...
Bouldin Alfalfa: 2021-10-07 13:25:00 (DOY 280)
Author: Daphne Szutu
Others: Dennis, Ari
Summary: Regular data collection/cleaning, alfalfa mow past due, veg height measurement
| 2021-10-07 Bouldin Alfalfa Dennis, Ari, and I arrived at the bouncer tower at 13:25 PDT. It was a pleasant day, mild and partly cloudy with a slight breeze. The alfalfa is tall, flowering, and still not mowed either—maybe they are too busy with the corn harvest? The alfalfa fields between our field and the barn all look green. Two fields to the east (by the levee), the field had been mowed and baled, but the field directly east of us was also tall and flowering (“getting long in the tooth,†described Dennis). The alfalfa we cut under the towers at our last site visit has grown 15-20cm tall. I downloaded the bouncer data by swapping microSD cards and using CardConvert to convert the card data to the laptop. We cleaned the small solar panel, which had some bird poop. Dennis and Ari took some photos for Carlos. Dennis and Carlos talked on the phone briefly listing all the different combination of fields the advection study might see with green vs. mown alfalfa and green vs. dry corn and fallow or flooded fields. We arrived at the main tower at 13:45 PDT. I downloaded met, camera, and USB GHG data. I downloaded the FD data and cleared its memory. I downloaded the IRT data by swapping microSD cards and using CardConvert to convert the fast data to TOB1 and the slow data to TOA5. The 10sec Temp/RH data on the camera card looked reasonable. I checked the phenocam clock and changed it +1min to match the laptop time. Dennis took veg height measurements. Ari cleaned flux and rad sensors. The reservoir was 1/3 empty; we refilled it. LI-7500 readings: CO2 377ppm H2O 552ppm T 21.6C P 101.3kPa SS 96--> 100 after cleaning LI7700 readings: CH4 1.97 RSSI 28--> 89 after cleaning We left at 14:15. |
Next Mowing: 2021-10-13
Veg Height (cm): Tape measure from ground to top of plant - Alfalfa flowering and ready to be mowed
69, 69, 74, 69, 74, 65, 75, 83, 81, 79, 82, 72, 72, 82, avg = 74.7, stdev = 5.82
4 photos found
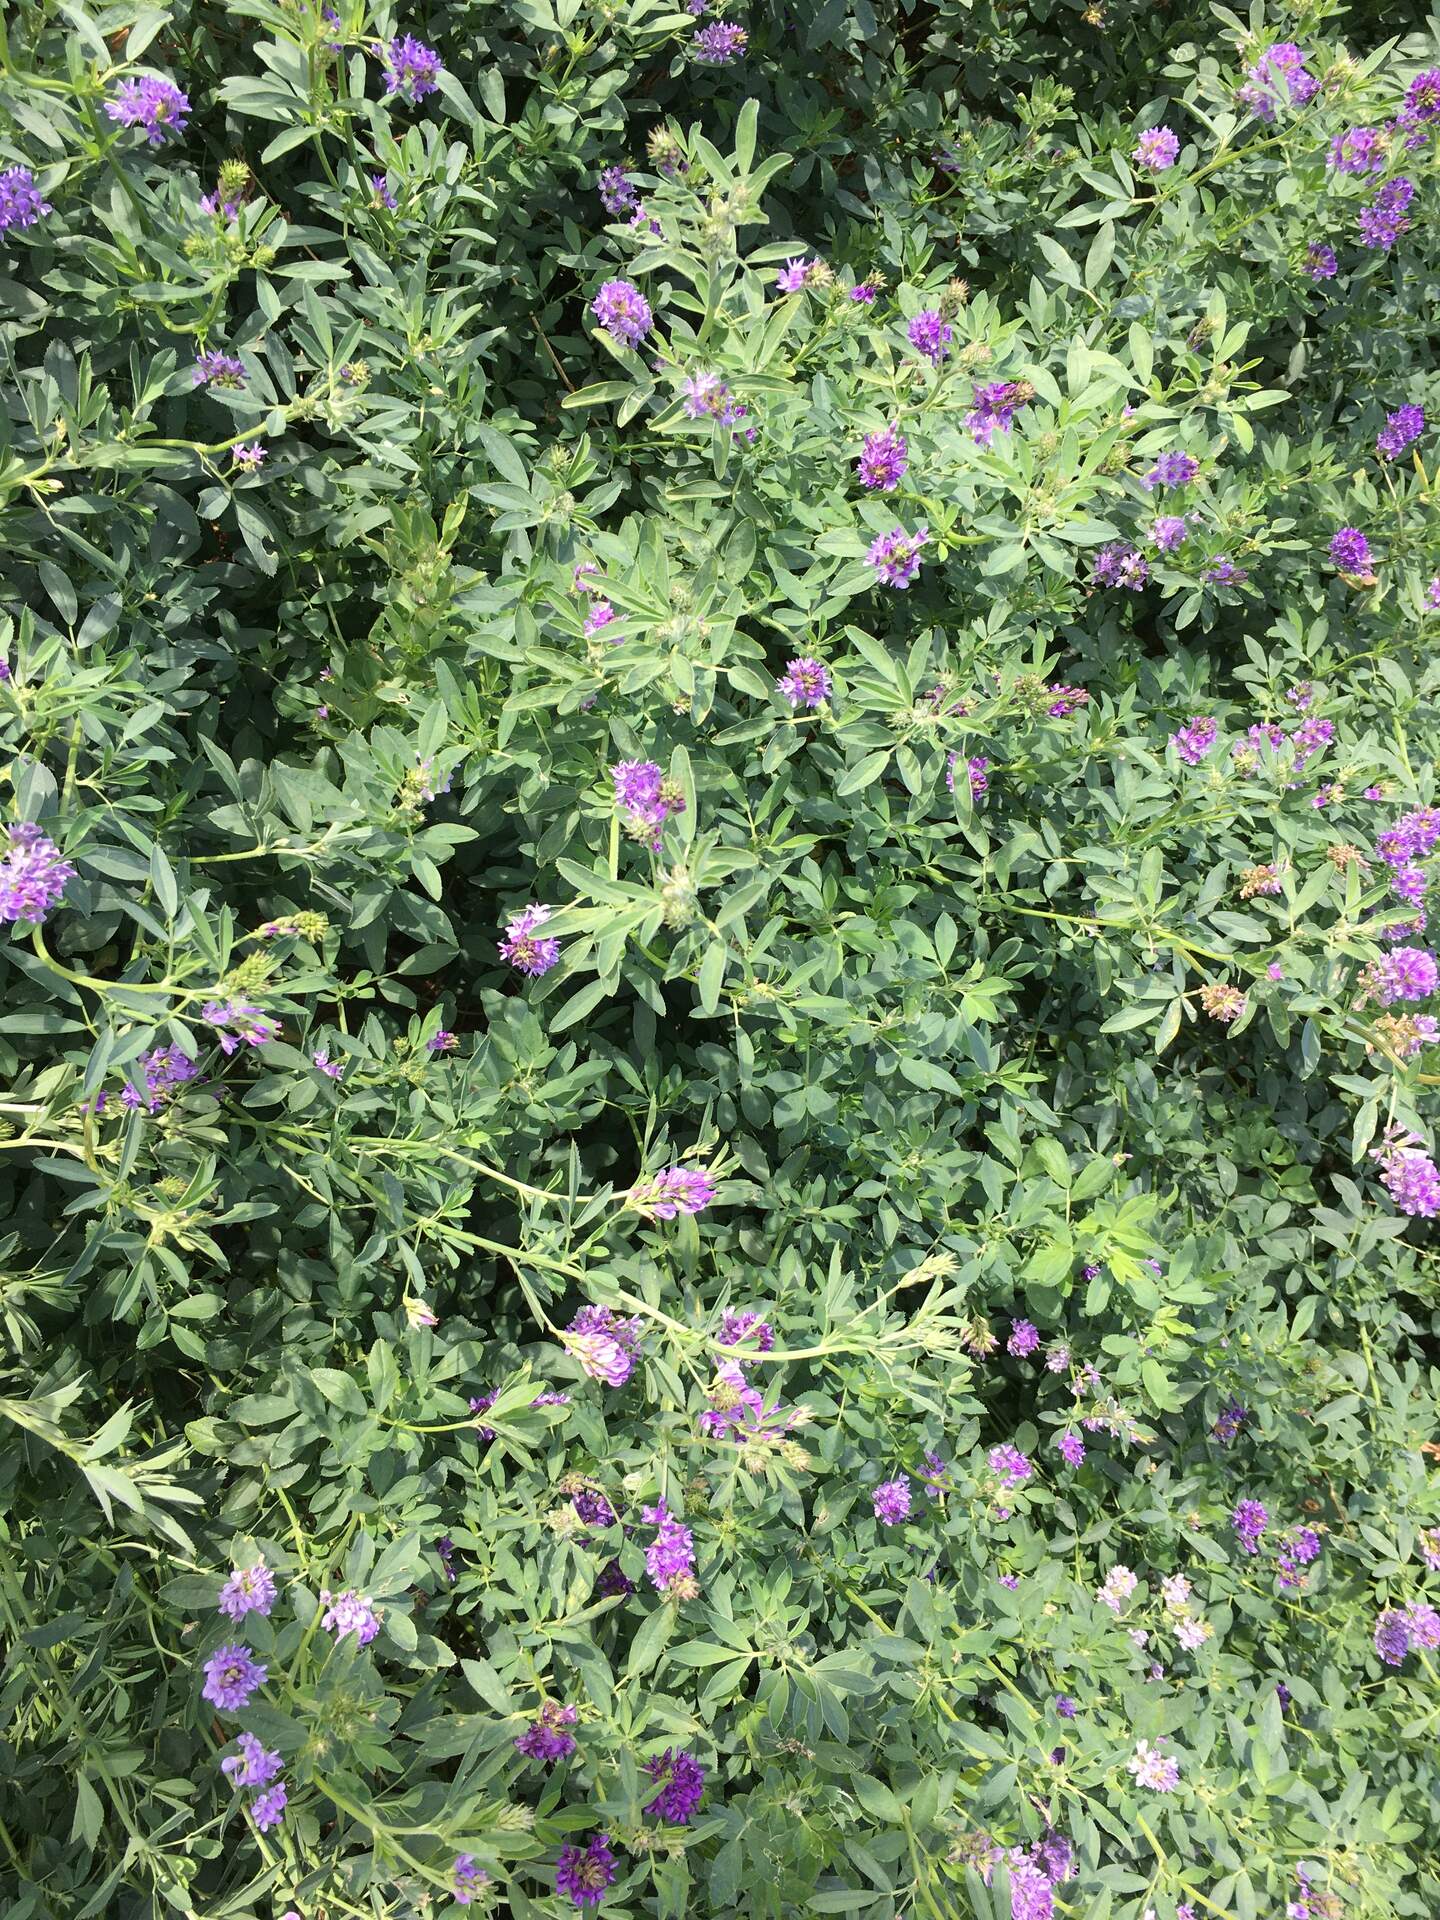
20211007BA_AlfalfaFlowers.jpg ( 2021-10-07 13:38:25 ) Full size: 1440x1920
Alfalfa getting "long in the tooth," flowering and super tall
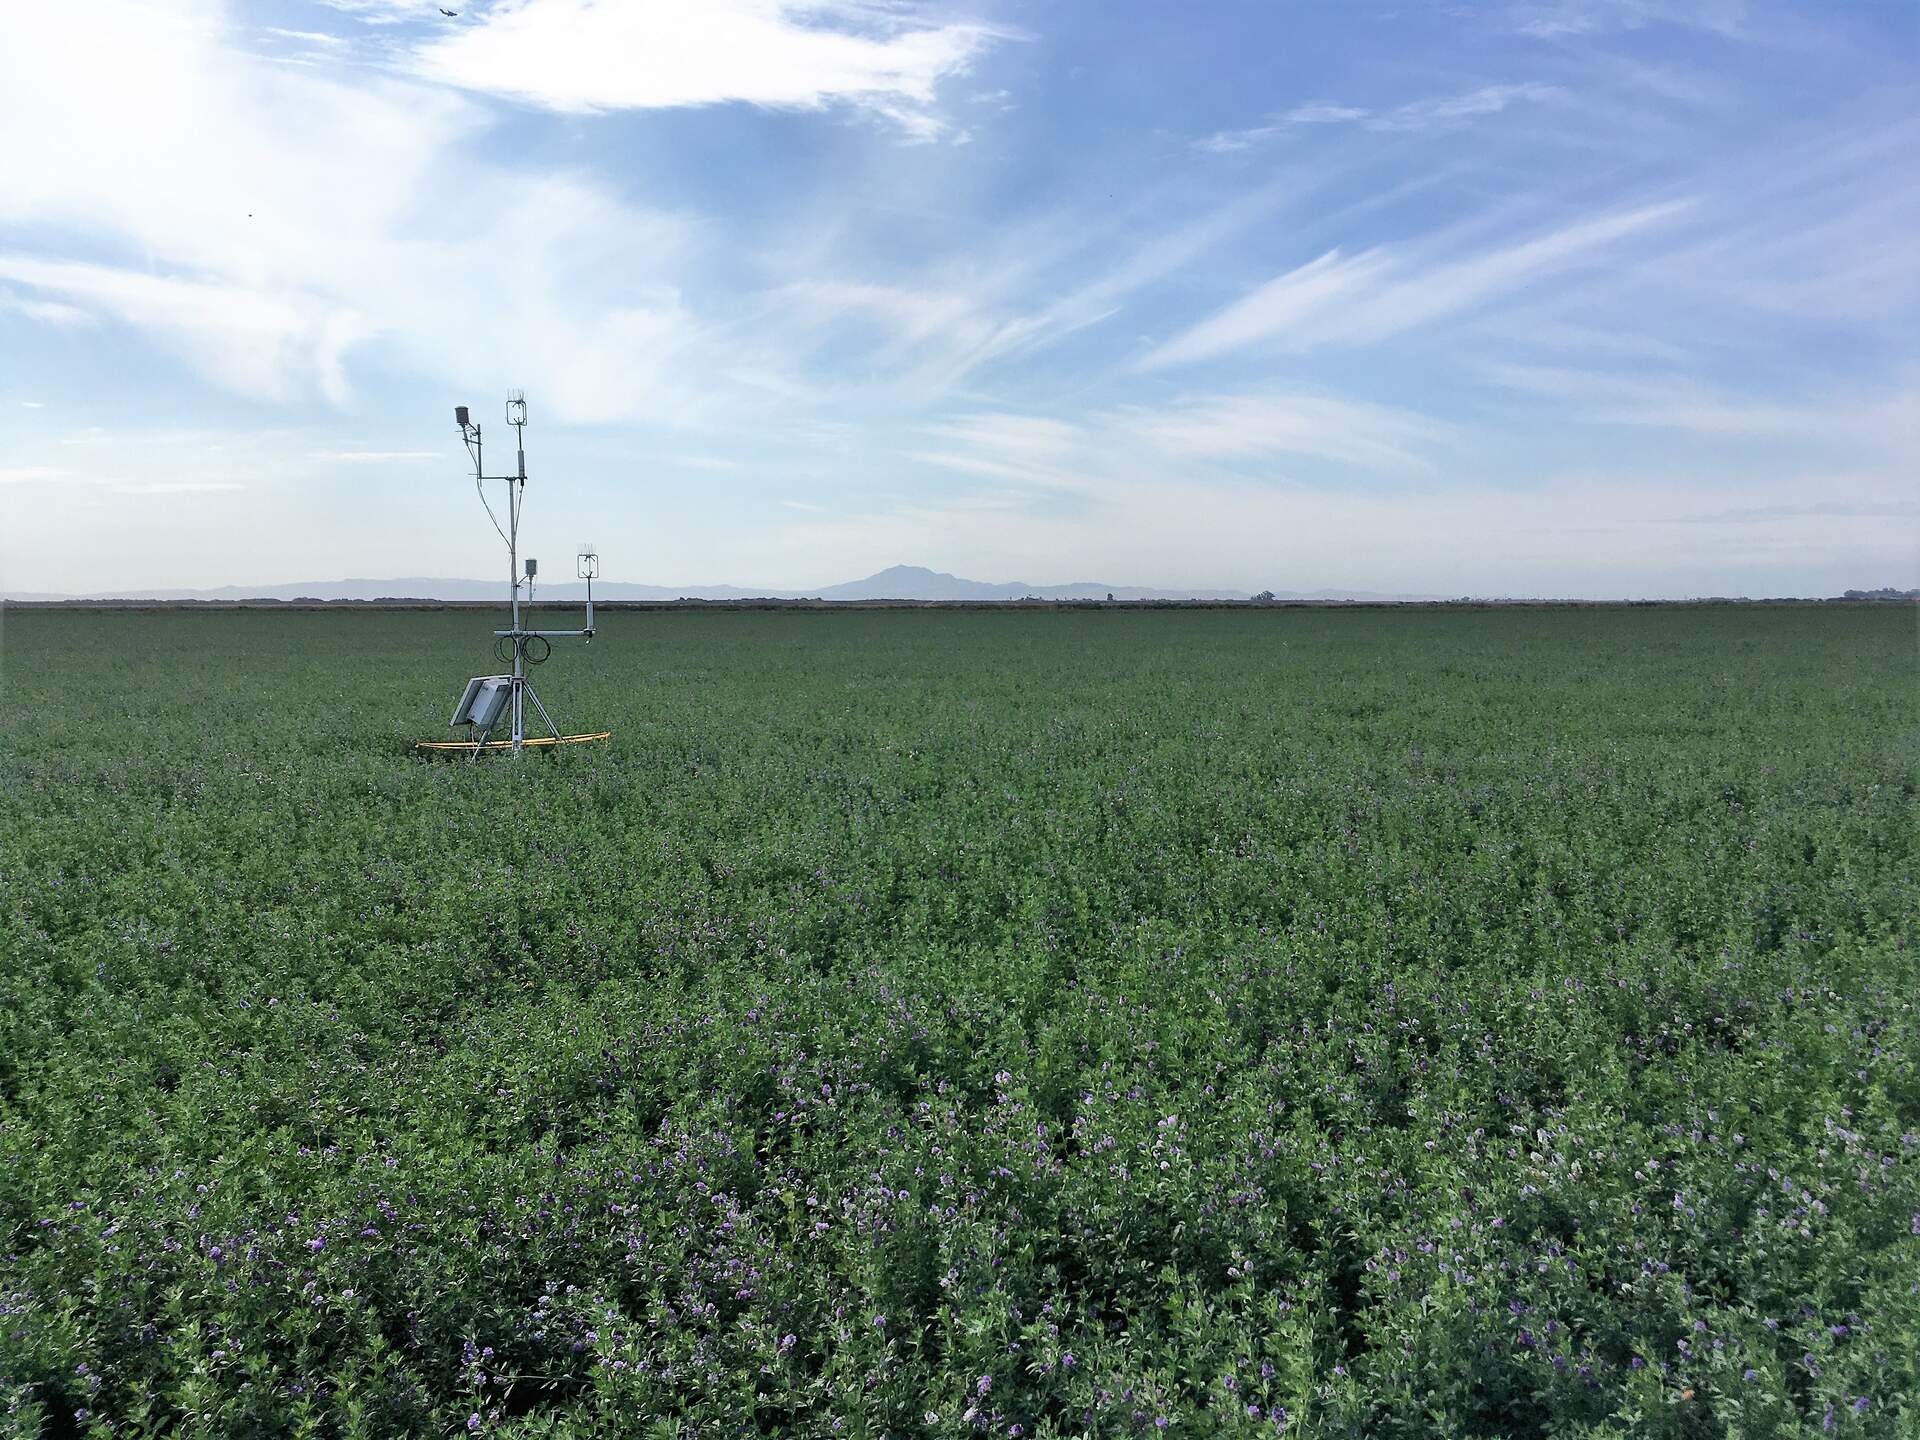
20211007BA_Bouncer.jpg ( 2021-10-07 13:26:21 ) Full size: 1920x1440
Looking west from the bouncer tower. The area under the tower was cut at the previous site visit 2 weeks ago because we thought mowing was imminent--still not mowed, though.

20211007BA_Bouncer2.jpg ( 2021-10-07 13:27:02 ) Full size: 1440x1920
Looking north from the bouncer tower. The area under the tower was cut at the previous site visit 2 weeks ago because we thought mowing was imminent--still not mowed, though.
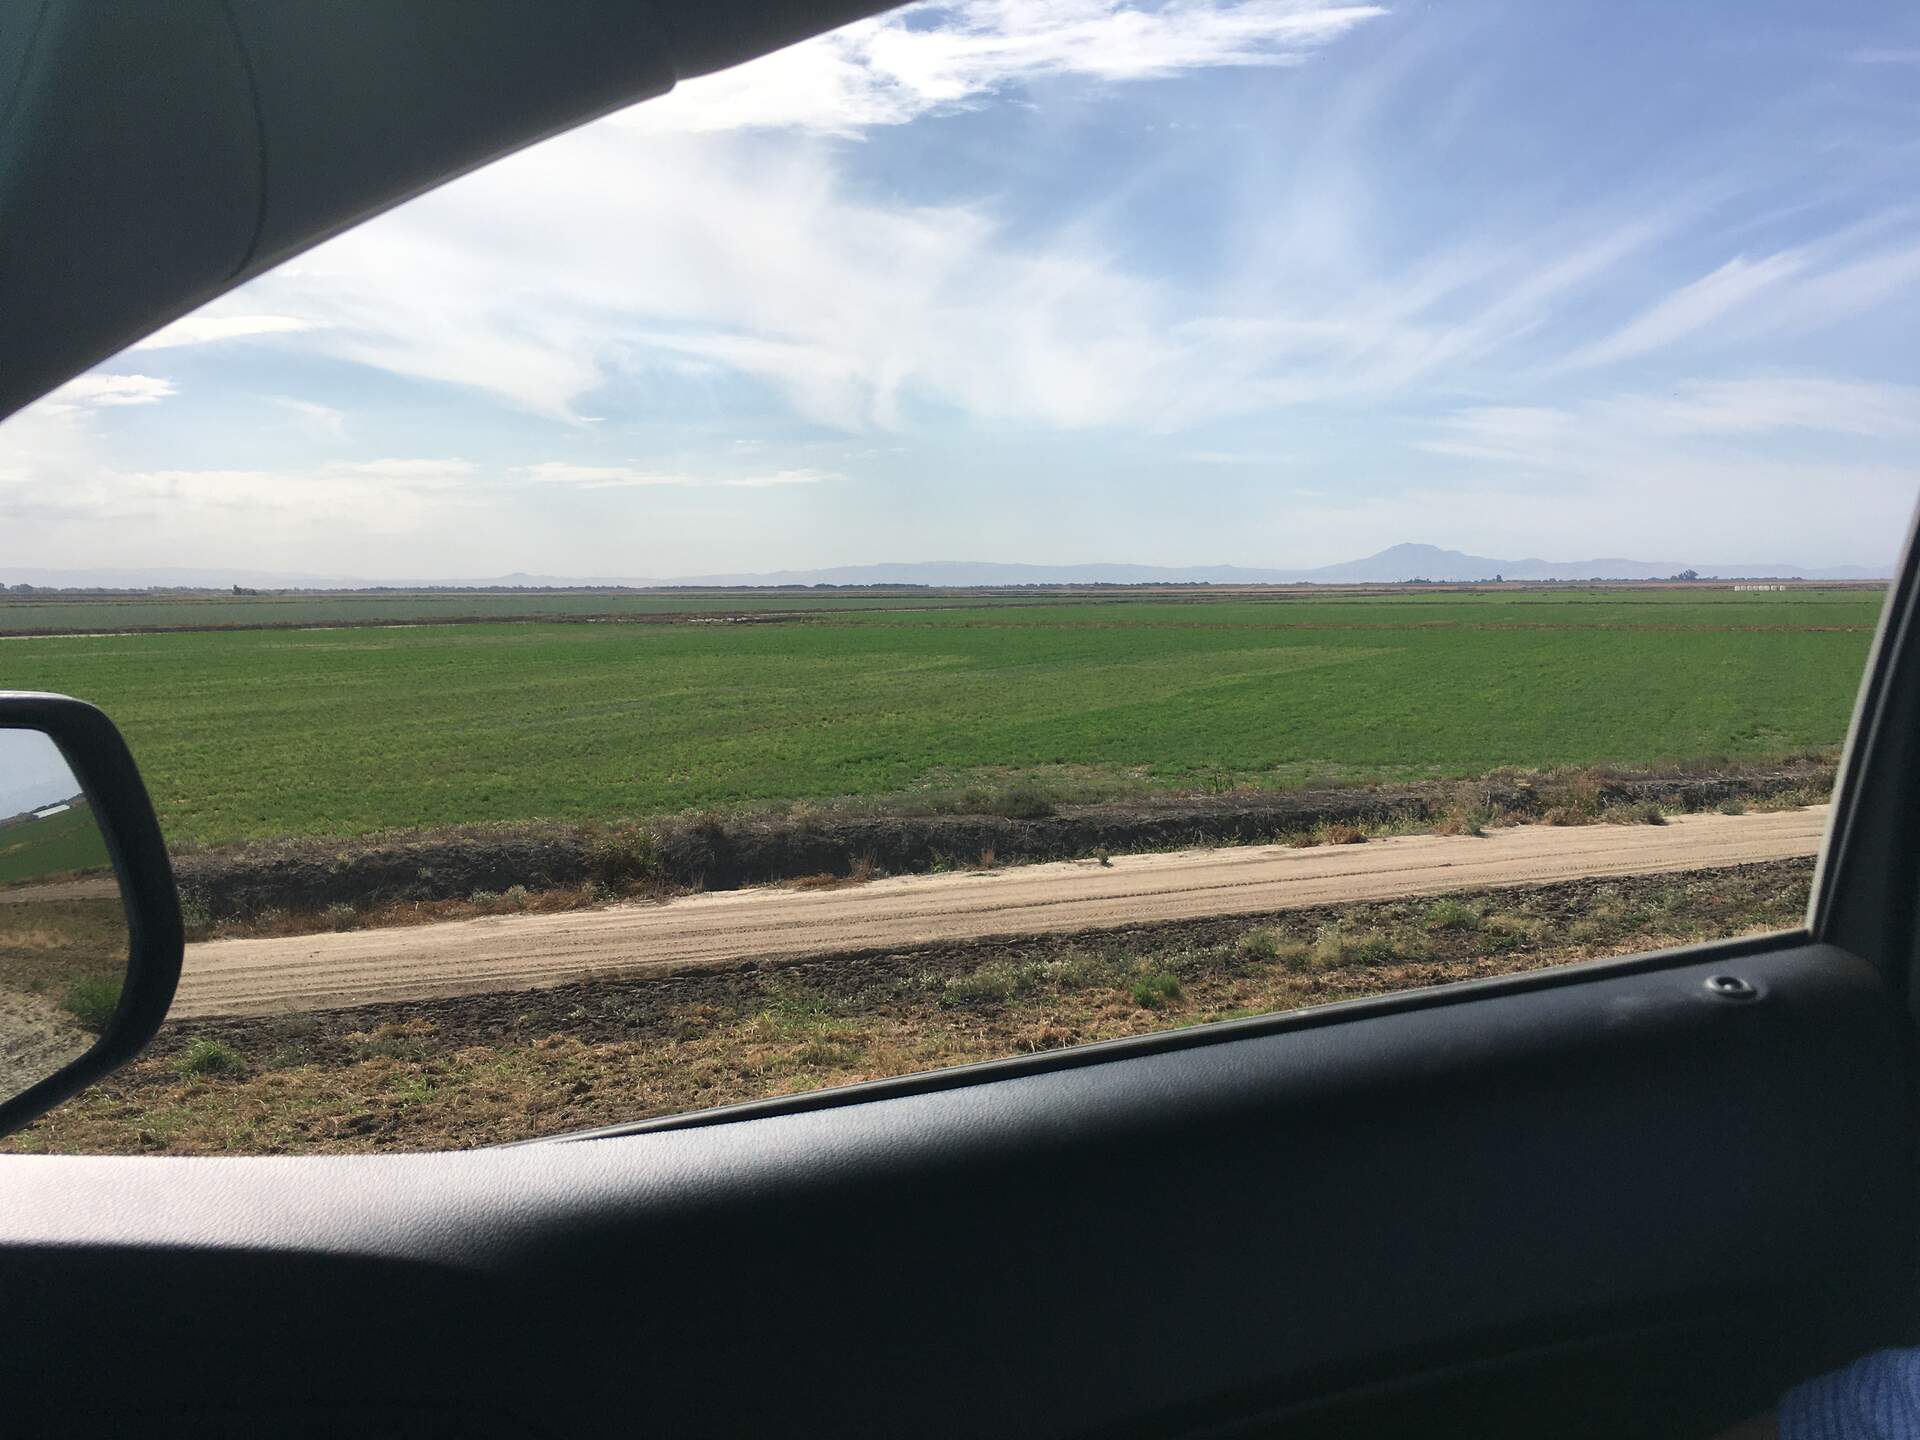
20211007BA_ViewFromLevee.jpg ( 2021-10-07 13:20:31 ) Full size: 1920x1440
Photo taken from the levee. Alfalfa fields in the row north of our field are generally pretty green.
7 sets found
5 BA_flux graphs found
21 BA_met graphs found
6 BA_arable graphs found
Can't check TATWBABCSB_cam
Can't check MBSWEEWPBCBA
2 BA_processed graphs found
No data found for BA_adex.