
Field Notes
<--2021-09-23 08:45:00 | 2021-10-21 16:15:00-->Other sites visited today: Gilbert Tract | Mayberry | West Pond | East End | Bouldin Alfalfa
Phenocam link: Searching...
Bouldin Corn: 2021-10-07 12:45:00 (DOY 280)
Author: Daphne Szutu
Others: Dennis, Ari
Summary: Regular data collection/cleaning, still no harvest yet
| 2021-10-07 Bouldin Corn Dennis, Ari, and I arrived at 12:45 PDT. It was a pleasant day, mild and partly cloudy with a slight breeze. Our corn is still here, no harvest yet on our field. However, we did see equipment harvesting some of the other corn fields west of us (fields south of Hwy 12). I downloaded met, cam, and USB GHG data. I downloaded the FD data and cleared its memory. I downloaded the PA data and cycled its power. I downloaded the IRT data by swapping microSD cards and using CardConvert to convert the fast data to TOB1 and the slow data to TOA5. Ari cleaned flux and rad sensors. Dennis collected some dry corn to bring home as autumn decorations. LI-7500 readings: CO2 405ppm H2O 366ppm T 22.7C P 101.4kPa SS 96 --> 102 after cleaning LI7700 readings: CH4 2.0 RSSI 52 --> 71 after cleaning We left at 13:05 PDT. 10/16 11:00am GHG file - corrupt file, with some gibberish at the end. Missing data from 11:53 to 13:46. Probably a power outage. |
2 photos found
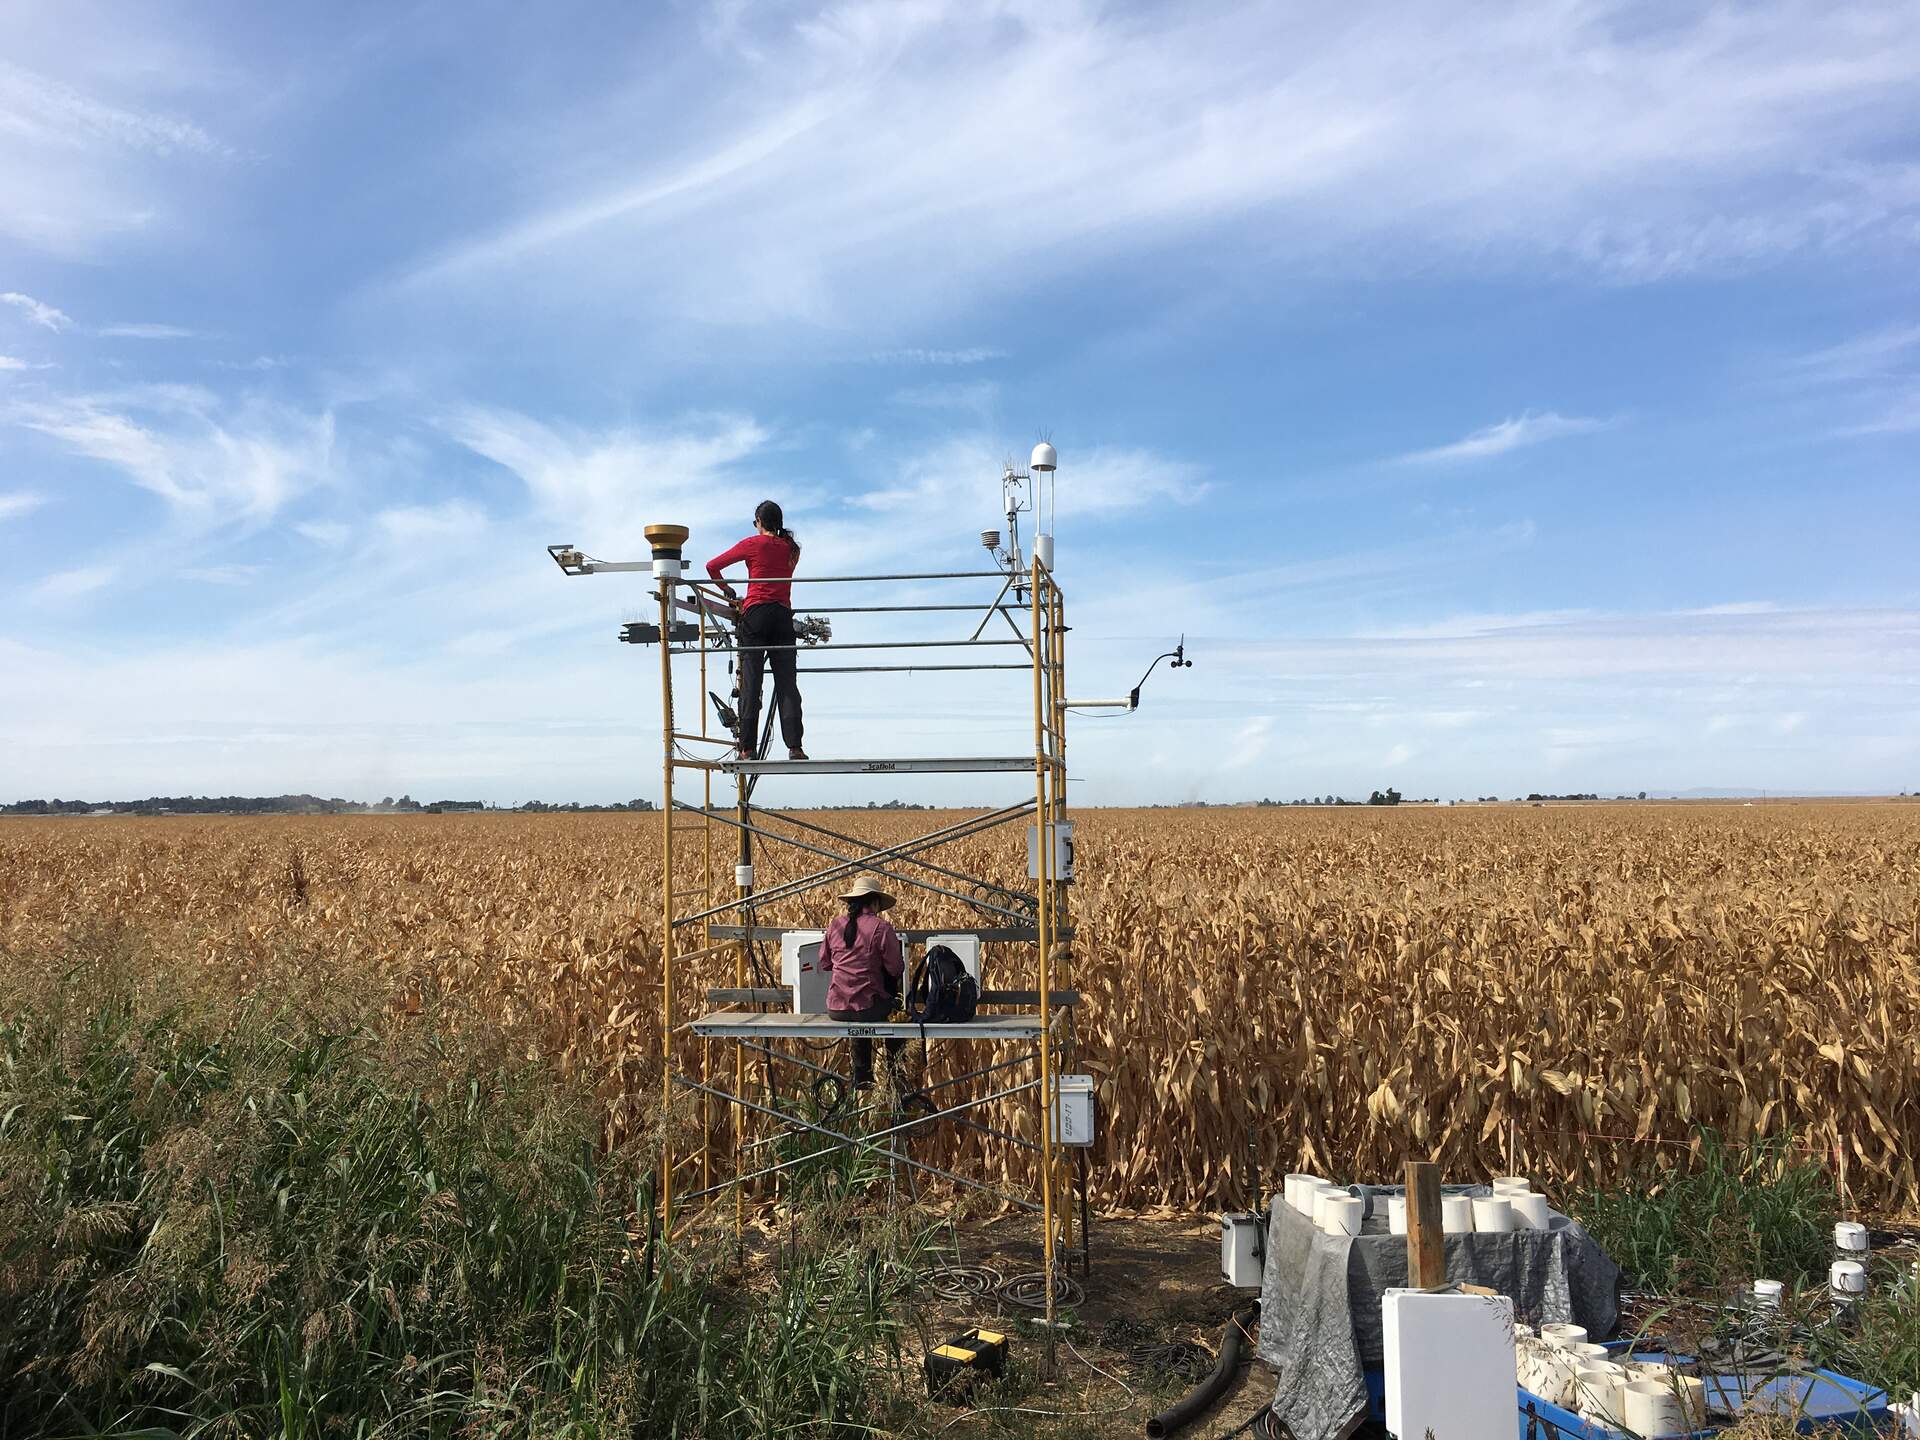
20211007BC_AriDaphne.jpg ( 2021-10-07 12:46:37 ) Full size: 1920x1440
Ari and Daphne servicing the site. Still waiting for corn to be harvested.

20211007BC_DryCorn.jpg ( 2021-10-07 12:45:38 ) Full size: 1920x1440
Ari on site and our tower is measuring dry, dry corn
6 sets found
17 BC_met graphs found
5 BC_flux graphs found
Can't check TATWBABCSB_cam
Can't check MBSWEEWPBCBA
2 BC_pa graphs found
1 BC_arable graphs found