Field Notes
<--2021-07-21 11:15:00 | 2021-08-17 11:20:00-->Other sites visited today: Hill Slough | Bouldin Corn | Bouldin Alfalfa | East End | Mayberry | Sherman Wetland
Phenocam link: Searching...
West Pond: 2021-08-04 14:20:00 (DOY 216)
Author: Daphne Szutu
Others: Carlos
Summary: Regular data collection/cleaning, windy, not much water at surface
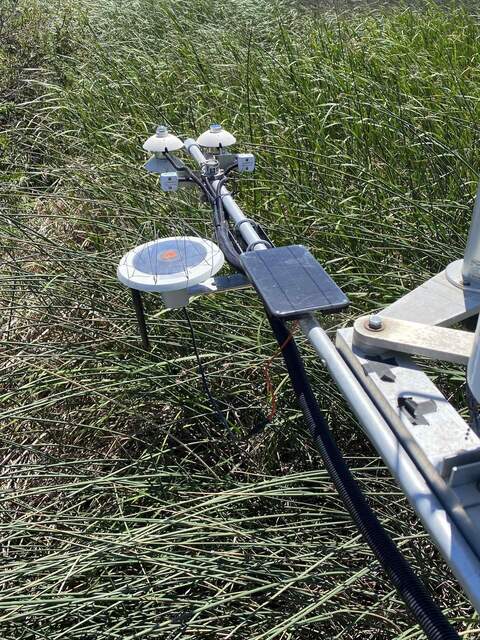
| 2021-08-04 West Pond Carlos and I arrived at 14:20 PDT. It was sunny, warm, and quite windy, although the tall tules blocked the wind at the tower somewhat. The inlet was off and the water level has been going down. The staff gauge read 29cm. I downloaded met, camera, USB GHG, and miniDOT data. I lowered the miniDOT a bit to get it in a bit more water, but there wasn’t much water at the surface. The camera was tilted down and we propped it up again. Carlos cleaned flux and rad data. I topped off the wash reservoir and left the lid open to deter the wasps that were congregating. Carlos took a photo of the Arable over the wetland veg. LI-7500 readings: CO2 406ppm H2O 560ppm T 28.5C P 101.2kPa SS 98 --> 99 after cleaning LI7700 readings: CH4 2.0 RSSI 20 --> 84 after cleaning We left around 14:40 PDT. |
1 photos found

20210804WP_Arable.jpg ( 2021-08-04 14:23:46 ) Full size: 1440x1920
Arable installed over tules at West Pond tower
8 sets found
Can't check WP_DO
1 WP_DO graphs found
14 WP_met graphs found
5 WP_flux graphs found
Can't check MBWPEESWGT_mixed
Can't check MBEEWPSWEPGT_cam
Can't check MBSWEEWPBCBA
1 WP_processed graphs found
4 WP_arable graphs found

