Field Notes

<--2021-07-28 11:00:00 | 2021-08-17 15:30:00-->
Other sites visited today: Hill Slough | Bouldin Corn | Bouldin Alfalfa | West Pond | East End | Mayberry

Sherman Wetland: 2021-08-04 16:50:00 (DOY 216)
Author: Daphne Szutu
Others: Carlos

Summary: Regular data collection/cleaning, more cattails chewed by caterpillars, water level going down

2021-08-04
Sherman Wetland

Carlos and I arrived at 16:50 PDT. It was breezy and warm. The caterpillars continue their cattail buffet—many more cattails looked chewed this time, maybe about 50% of the cattails we can see from the boardwalk/tower looked chewed. I scrubbed the staff gauge a bit more since the water level has gone down. The staff gauge read 82cm.

Patty has removed her equipment and power line. There is one gas tank for us to take back the next time we bring a dolly.

I downloaded met, camera, USB GHG, and miniDOT data. Carlos cleaned flux and rad sensors and topped off the wash reservoir.

LI-7500 readings:
CO2 397ppm
H2O 700ppm
T 27.8C
P 101.1kPa
SS 97--> 99 after cleaning
LI7700 readings:
CH4 1.9ppm
RSSI 49--> 81 after cleaning

We left around 17:10 PDT.

1 photos found

Caterpillars have chewed up this patch of cattail which are now much shorter compared to the tules
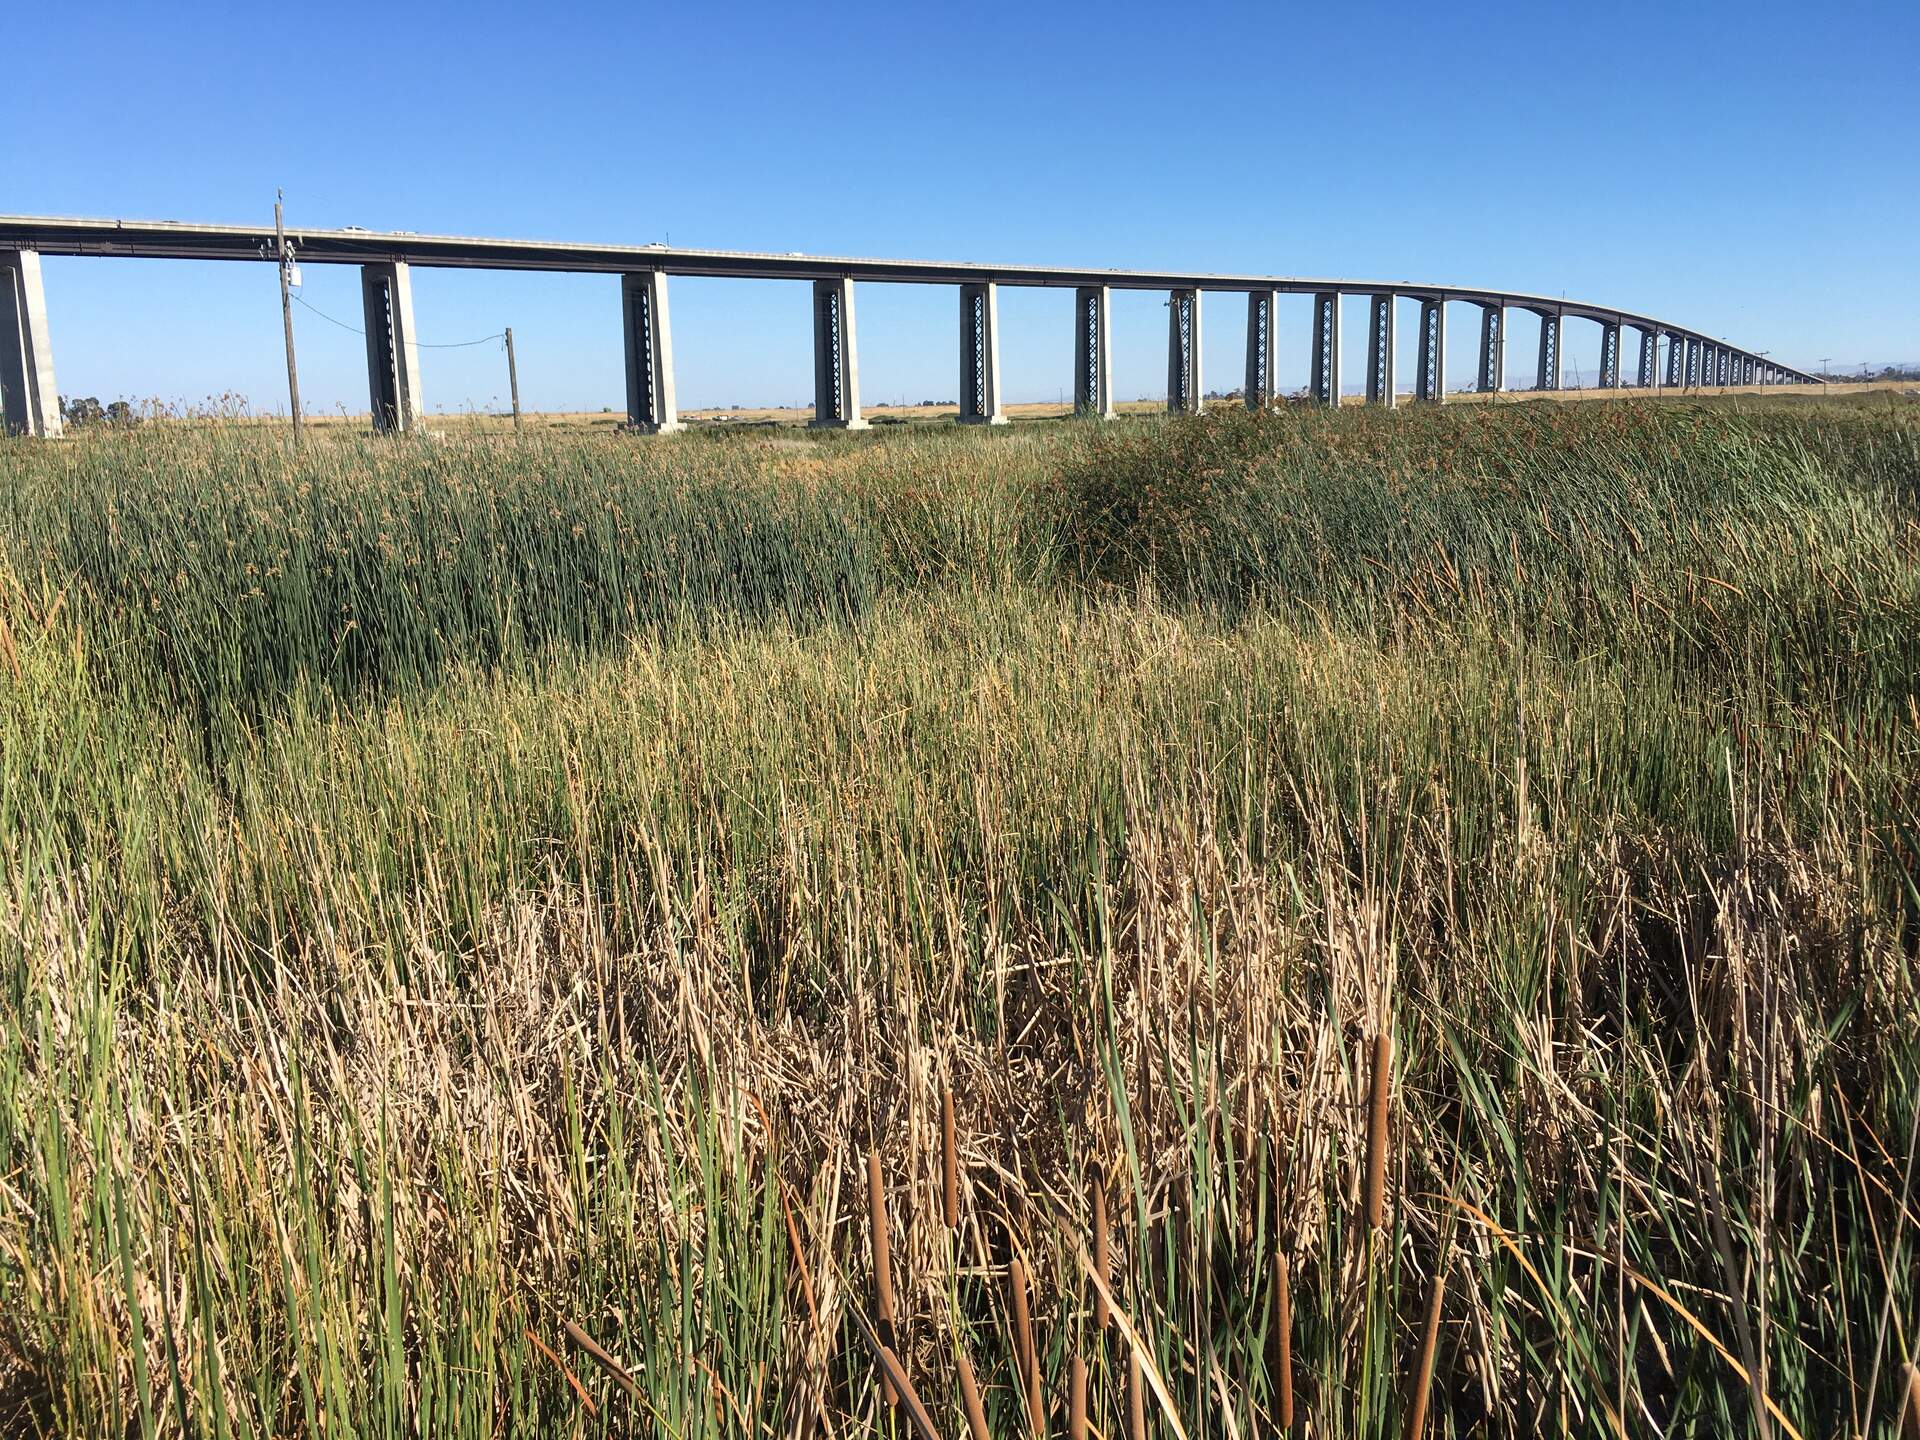
20210804SW_ChewedCattail.jpg ( 2021-08-04 17:09:58 ) Full size: 1920x1440
Caterpillars have chewed up this patch of cattail which are now much shorter compared to the tules

Graphs display:
7 sets found

Can't check MBWPEESWGT_mixed
Can't check MBEEWPSWEPGT_cam
16 SW_met graphs found

Explore the graph:Temperatures in a new window

Explore the graph:Water Temperature Profile A in a new window

Explore the graph:Water Temperature Profile B in a new window

Explore the graph:Soil Temperature Profile C2 in a new window

Explore the graph:Soil Heat Flux in a new window

Explore the graph:Four channel Radiometer in a new window

Explore the graph:Sherman Wetland PAR in a new window

Explore the graph:PRI Channels in a new window

Explore the graph:NDVI Channels in a new window

Explore the graph:Water level and Rain in a new window

Explore the graph:Dissolved CO2 in a new window

Explore the graph:Air Pressure in a new window

Explore the graph:Battery Voltage and RH in a new window

Explore the graph:Soil Temperature Profile C1 in a new window

Explore the graph:SRS NDVI and PRI in a new window

Explore the graph:SW miniDOT Dissolved Oxygen in a new window

4 SW_flux graphs found

Explore the graph:CO2 and H2O in a new window

Explore the graph:Wind in a new window

Explore the graph:Methane in a new window

Explore the graph:Data Counts in a new window

Can't check MBSWEEWPBCBA
Can't check SW_Temp
14 SW_Temp graphs found

Explore the graph:Temperatures in a new window

Explore the graph:CO2 and H2O in a new window

Explore the graph:Wind in a new window

Explore the graph:Methane in a new window

Explore the graph:Data Counts in a new window

Explore the graph:Temperature Profile A in a new window

Explore the graph:Temperature Profile B in a new window

Explore the graph:Temperature Profile C in a new window

Explore the graph:Soil Heat Flux in a new window

Explore the graph:Four-channel radiometer in a new window

Explore the graph:NDVI Channels in a new window

Explore the graph:PAR in a new window

Explore the graph:Air Pressure and Water Level in a new window

Explore the graph:Air T and RH in a new window

3 SW_arable graphs found

Explore the graph:Incoming Solar Bands in a new window

Explore the graph:Reflected Solar Bands in a new window

Explore the graph:Solar Radiation in a new window