Field Notes
<--2021-07-07 09:00:00 | 2021-07-20 08:10:00-->Phenocam link: Searching...
Hill Slough: 2021-07-08 08:00:00 (DOY 189)
Author: Ariane Arias-Ortiz
Others: Daphne, Carlos, Joe, Dennis
Summary: Soil core collection (day 2)
| Daphne, Carlos, Joe, Dennis and I arrived at Hill Slough at 8:00 am PDT. It was mild when we arrived, but temperatures were expected to reach 99 F from 2 to 4 pm. It was not windy as usually, we missed the natural AC. We started at location 4, where Daphne, Carlos and I left off the day before. At location 4, soils are soft and wet and look very organic. The site is close to where the levee breaching is planned. We sampled the long core using the wide auger which produces little or negligible soil compaction. Long cores were sliced in the field at 5 cm-thick intervals and the entire 5 cm layer was collected, rather than subsampled. We were limited in the number of short acrylic tubes we had available, since we realized that a replicate core of the upper layers had to be collected alongside the long cores collected with the augers. Throughout the day then we collected one long core at each location, and 3 short cores: one right next to the long core, and 2 at the north and east directions rather than north, east and south. The goal of these cores is to see local heterogeneity, if any. Location 5 was south from location 4. Here the soils were very hard and compacted in contrast to location 4. They had a sandy texture with grey tones. We used the wide auger to sample the upper 35 cm and the narrow auger to sample from 35 to 80 cm depth. 3 short cores were also collected, the bottom end of one of them (north) broke/bent due to the hard nature of the soil. Location 6 was vegetated by creeping saltbush and dead cattails were found onsite, mosquitos and ticks too. We sampled long cores using the wide auger. It worked well but soils from 15 to 20 cm slid down the auger creating a void at these depths. We could not merge the two sections together as soils remained adhered to the cylinder. 3 short cores were also sampled. Location 7 was about 200 meters south-west of the tower. We sampled at a dry pond that had a salt crust on the surface. Soils were orange-ish and were soft, wet and uncompacted below ~10 cm depth. Both the narrow and wide auger failed in collecting the entire 1 meter soil column, soils collapsed down the borehole when extruding the augers. We were only able to sample the upper 35 cm using the augers. For that reason we collected the long soil core using a 60 cm long acrylic pipe instead. One short soil core was collected 2 meters east of this location. We used the soils collected with the auger as the second "short" core replicate at this site. Our last spot was location 8, north from the tower and part of the upland ecotone. Soils were very dry and broke in aggregates. We sampled the long core using the narrow auger and a short core was taken immediately next to it. Temperatures reached 95F while sampling at this site, so we decided to stop for the day. It was 2.30 pm PDT. We could not sample location 9 and short cores at locations 8 and 9, we plan to sample these site in a week or two. |
10 photos found
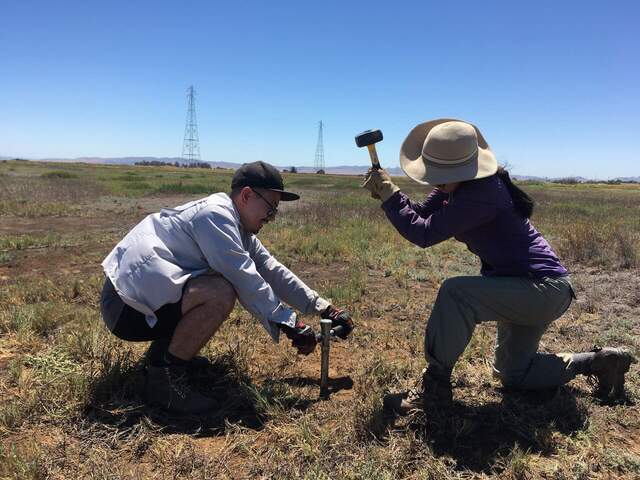
20210707HS_auger.jpg ( 2021-07-07 14:32:22 ) Full size: 1920x1440
Daphne and Carlos collecting a soil core with the narrow auger
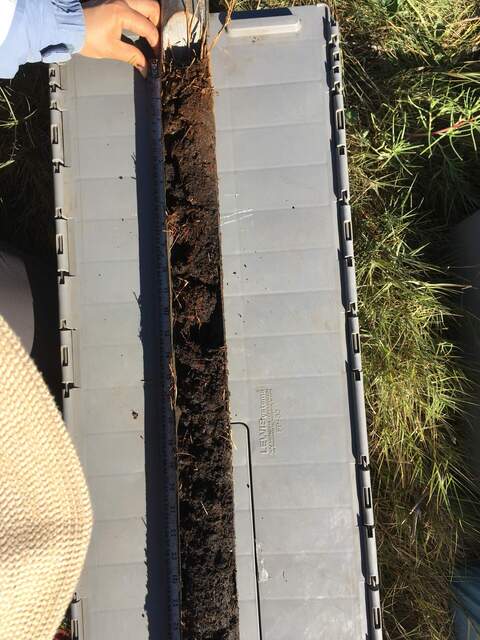
20210708HS_hsm4.jpg ( 2021-07-08 08:41:24 ) Full size: 1440x1920
long core sampled with the wide open faced auger
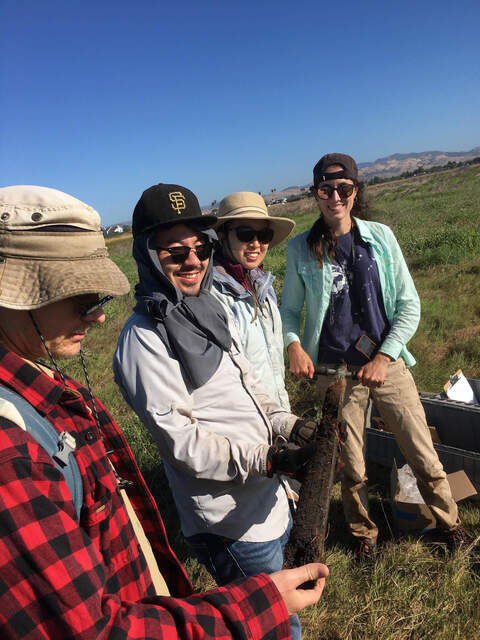
20210708HS_team.jpg ( 2021-07-08 08:41:24 ) Full size: 1440x1920
Joe, Carlos, Daphne, and Ari with long core hsm_4
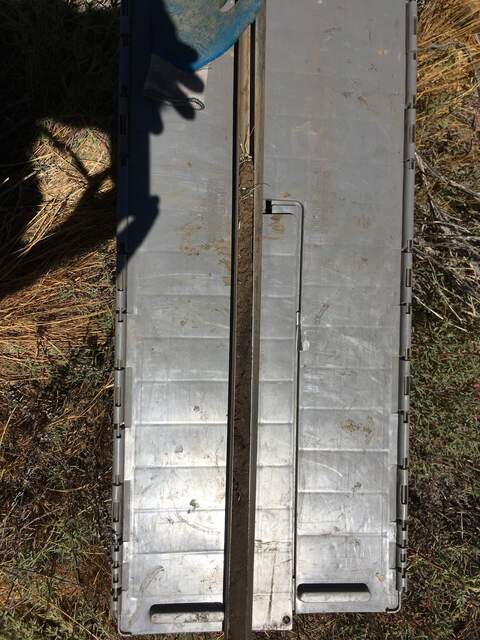
20210708HS_hsm8.jpg ( 2021-07-08 13:23:00 ) Full size: 1440x1920
long core sampled with the narrow open faced auger
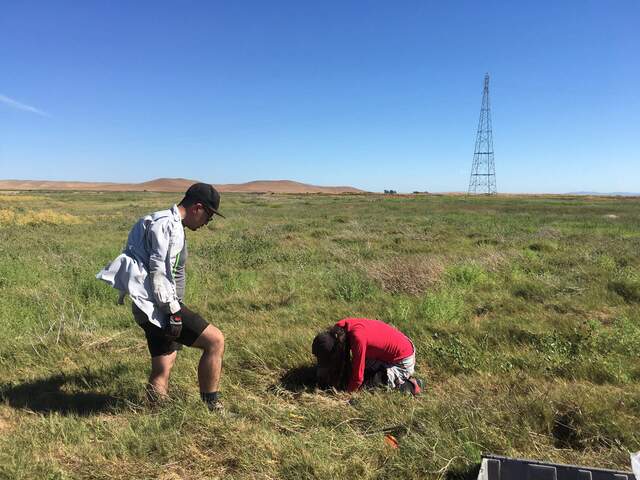
20210707HS_CarlosAri.jpg ( 2021-07-07 16:26:18 ) Full size: 1920x1440
Carlos and Ari taking short (30cm) soil cores at Hill Slough. Carlos's shirt indicates how windy it is that day.
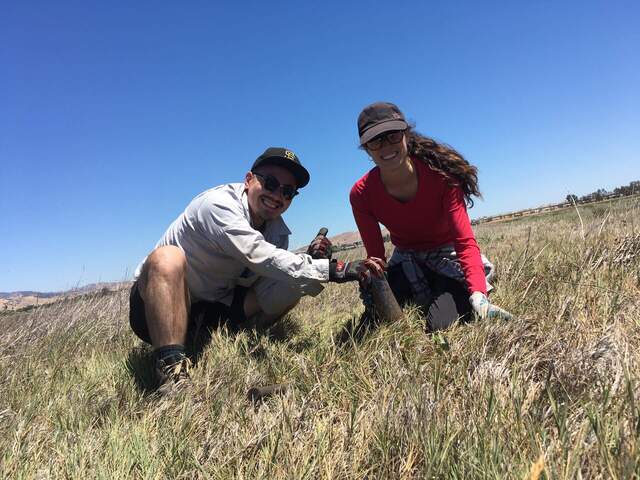
20210707HS_ShortSoilCore.jpg ( 2021-07-07 12:09:29 ) Full size: 1920x1440
Carlos and Ari with a short soil core.
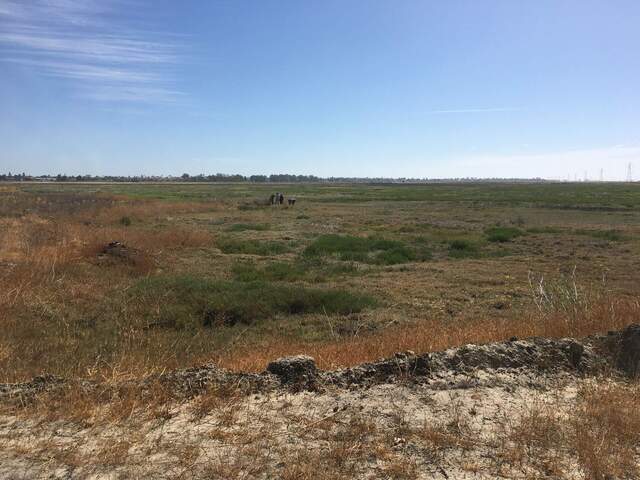
20210709HS_PrefloodSoilCoring.jpg ( 2021-07-09 00:00:00 ) Full size: 1920x1440
Joe, Ari, Daphne, and Carlos taking soil core samples before levee breach and flooding
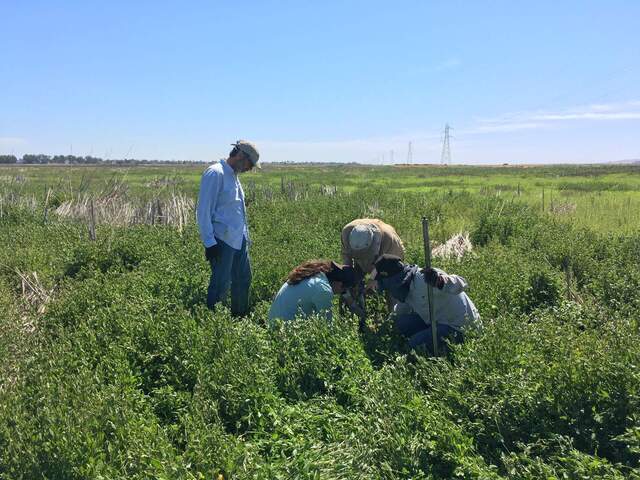
20210709HS_SoilCoring.jpg ( 2021-07-08 10:45:58 ) Full size: 1920x1440
Dennis, Joe, Ari, and Carlos taking soil core samples before levee breach/flooding. They are in a thick patch of lamb's quarters (or similar plant).
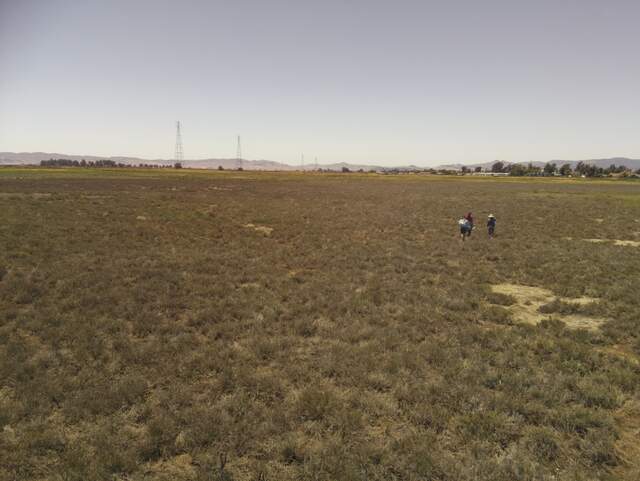
HS_picam_20210707_1215.jpg ( 2021-07-07 12:15:05 ) Full size: 1917x1440
Carlos, Ari, and Daphne sampling soils
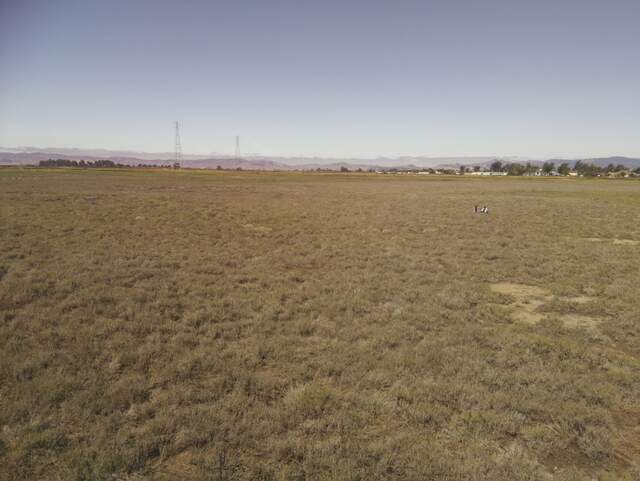
HS_picam_20210707_0915.jpg ( 2021-07-07 09:15:05 ) Full size: 1917x1440
Ari and Carlos taking soil samples
4 sets found
21 HS_met graphs found
4 HS_flux graphs found
1 HS_cam graphs found
Can't check HS_Processed
2 HS_Processed graphs found

