
Field Notes
<--2021-06-22 10:20:00 | 2021-07-08 08:00:00-->Phenocam link: Searching...
Hill Slough: 2021-07-07 09:00:00 (DOY 188)
Author: Ariane Arias-Ortiz
Others: Daphne, Carlos
Summary: Regular data collection/cleaning, soil cores (day 1)
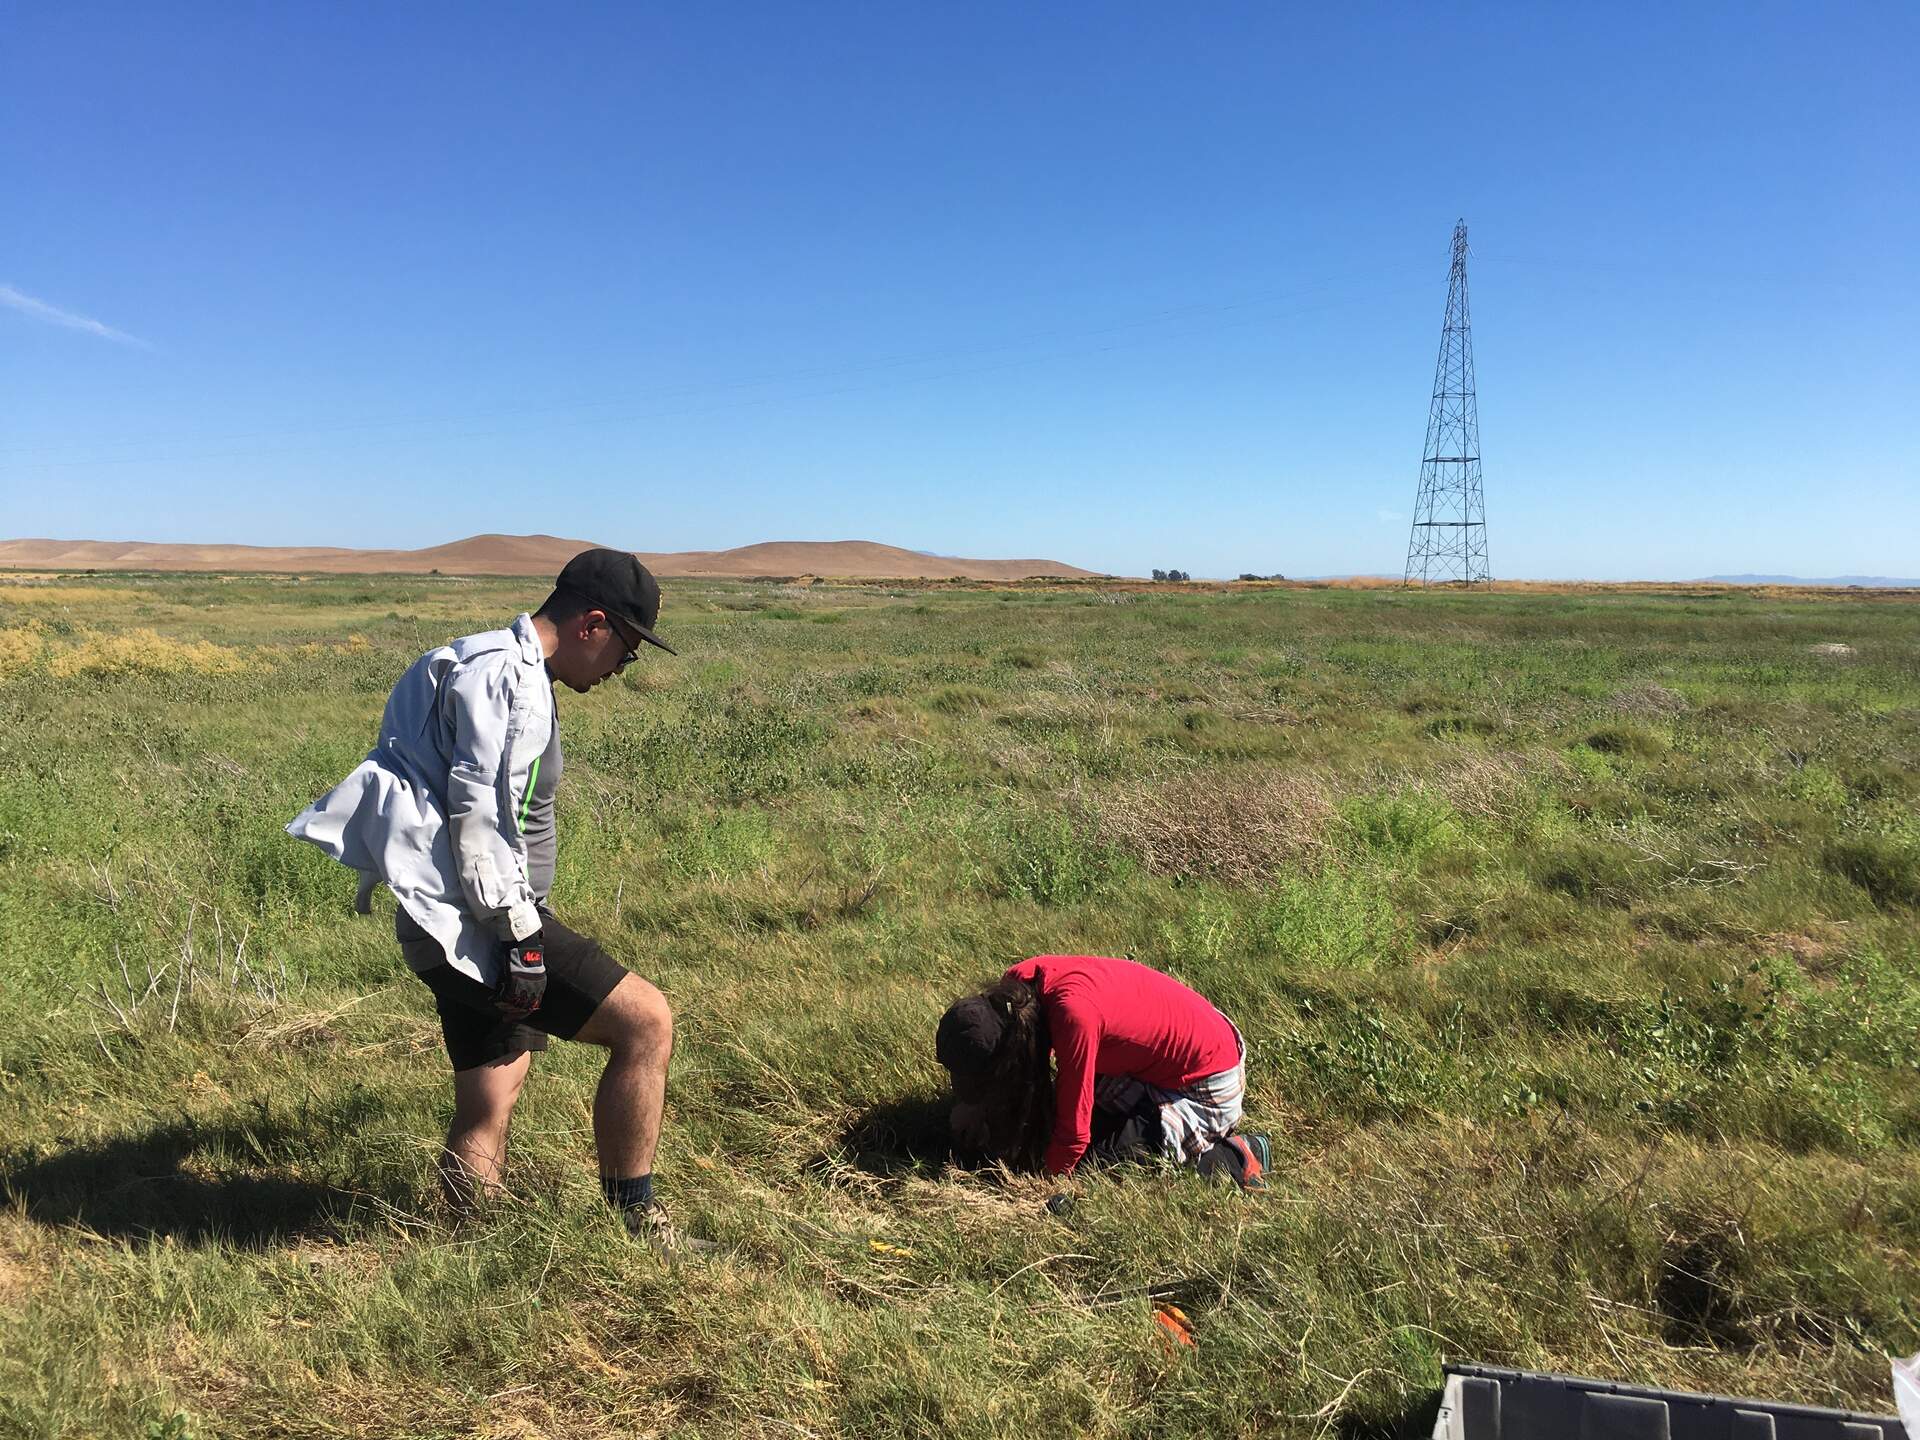
| Daphne, Carlos and I arrived at Hill Slough at around 9:00 am PDT. It was mild and windy with good visibility, and we could see the fog over the hills to our west. We drove all the way to the tower to unload the truck with all the coring material. We brought an aluminum ladder from the lab to help get on/off the boardwalk and we'll leave it in the locked enclosure next to the scaffolding. Daphne collected data from the tower and cleaned rad and flux sensors. Some of the 4-way channels had gaps and spikes; the wiring looked ok so she unplugged and replugged the mux block where the 4 channels were wired. She downloaded the FD data and cleared its memory. The wash reservoir was mostly full; she topped it off. Daphne checked the picam clock and it was fast by 7 minutes. She changed both the system clock and hwclock from 9:14 to 9:07. TC 1,9, and 21 have NANs and should be inspected further. LI-7500 readings: CO2 394ppm H2O 630ppm T 19.2C P 101.4kPa SS 101 --> 102 after cleaning LI7700 readings: CH4 1.9ppm RSSI 47 --> 73 after cleaning Carlos and I started at at the first coring location (closest to the tower site) and took 3 short cores using acrylic tubes (30 cm length, 7 cm diameter), 2 meters north, east and south of the long core coordinate location. See all coring locations in Hsm_core_logsheet here (https://berkeley.box.com/s/6aonkx9i9xj1s9fero3ig3lfri5od4hg). Sara and Josh from the Fish and Wildlife Department came to the tower site to meet us and recommended to avoid driving into the site in the future to protect endangered mice. Since we had finished unloading the truck, we parked it at the entrance of the boardwalk. Daphne Carlos and I went to location 2 and 3 and took 3 short cores at each site (N, E and S). We recorded coordinates, species present at the site, as well as soil compaction if observed. At noon Scott Jones from USGS stopped by the tower to lend us two 1-meter long auger/peat corers of different diameter to collect the long soil cores. We sampled long cores at locations hsm_1, hsm_2 and hsm_3 using the narrow diameter auger. Soils at these locations were very dry and top layers were unconsolidated. Bottom layers were clayey which prevented us from using the larger diameter auger (auger was getting stuck at depth and when twisting, metal started to bent). Compaction was observed and recorded using the narrow diameter auger. A short (~ 30 cm) soil core was taken immediately adjacent to the long core to have an intact/uncompacted sample of the upper 30 cm where most of the recent accumulation is likely recorded. Long cores were sliced in the field at 5 cm thick intervals. We used 5 ml syringes to subsample each layer, filling the syringe up to the 3 ml mark (~ width of the corer). We finished at location number 4, where we encountered problems using the narrow auger, compaction was about 50% and soils were wet and soft. We sampled the short cores, and postponed sampling the long coring at this site for the next day. Short cores were labeled with the Ameriflux site name (Hsm), core location number (from 1 to 9), and cardinal direction (N, E or S). Long cores and immediately adjacent short cores were labelled using the Ameriflux name and location number followed by an L (e.g., Hsm_1_L). We left at around 5:30 pm PDT. |
10 photos found
20210707HS_auger.jpg ( 2021-07-07 14:32:22 ) Full size: 1920x1440
Daphne and Carlos collecting a soil core with the narrow auger

20210708HS_hsm4.jpg ( 2021-07-08 08:41:24 ) Full size: 1440x1920
long core sampled with the wide open faced auger

20210708HS_team.jpg ( 2021-07-08 08:41:24 ) Full size: 1440x1920
Joe, Carlos, Daphne, and Ari with long core hsm_4

20210708HS_hsm8.jpg ( 2021-07-08 13:23:00 ) Full size: 1440x1920
long core sampled with the narrow open faced auger
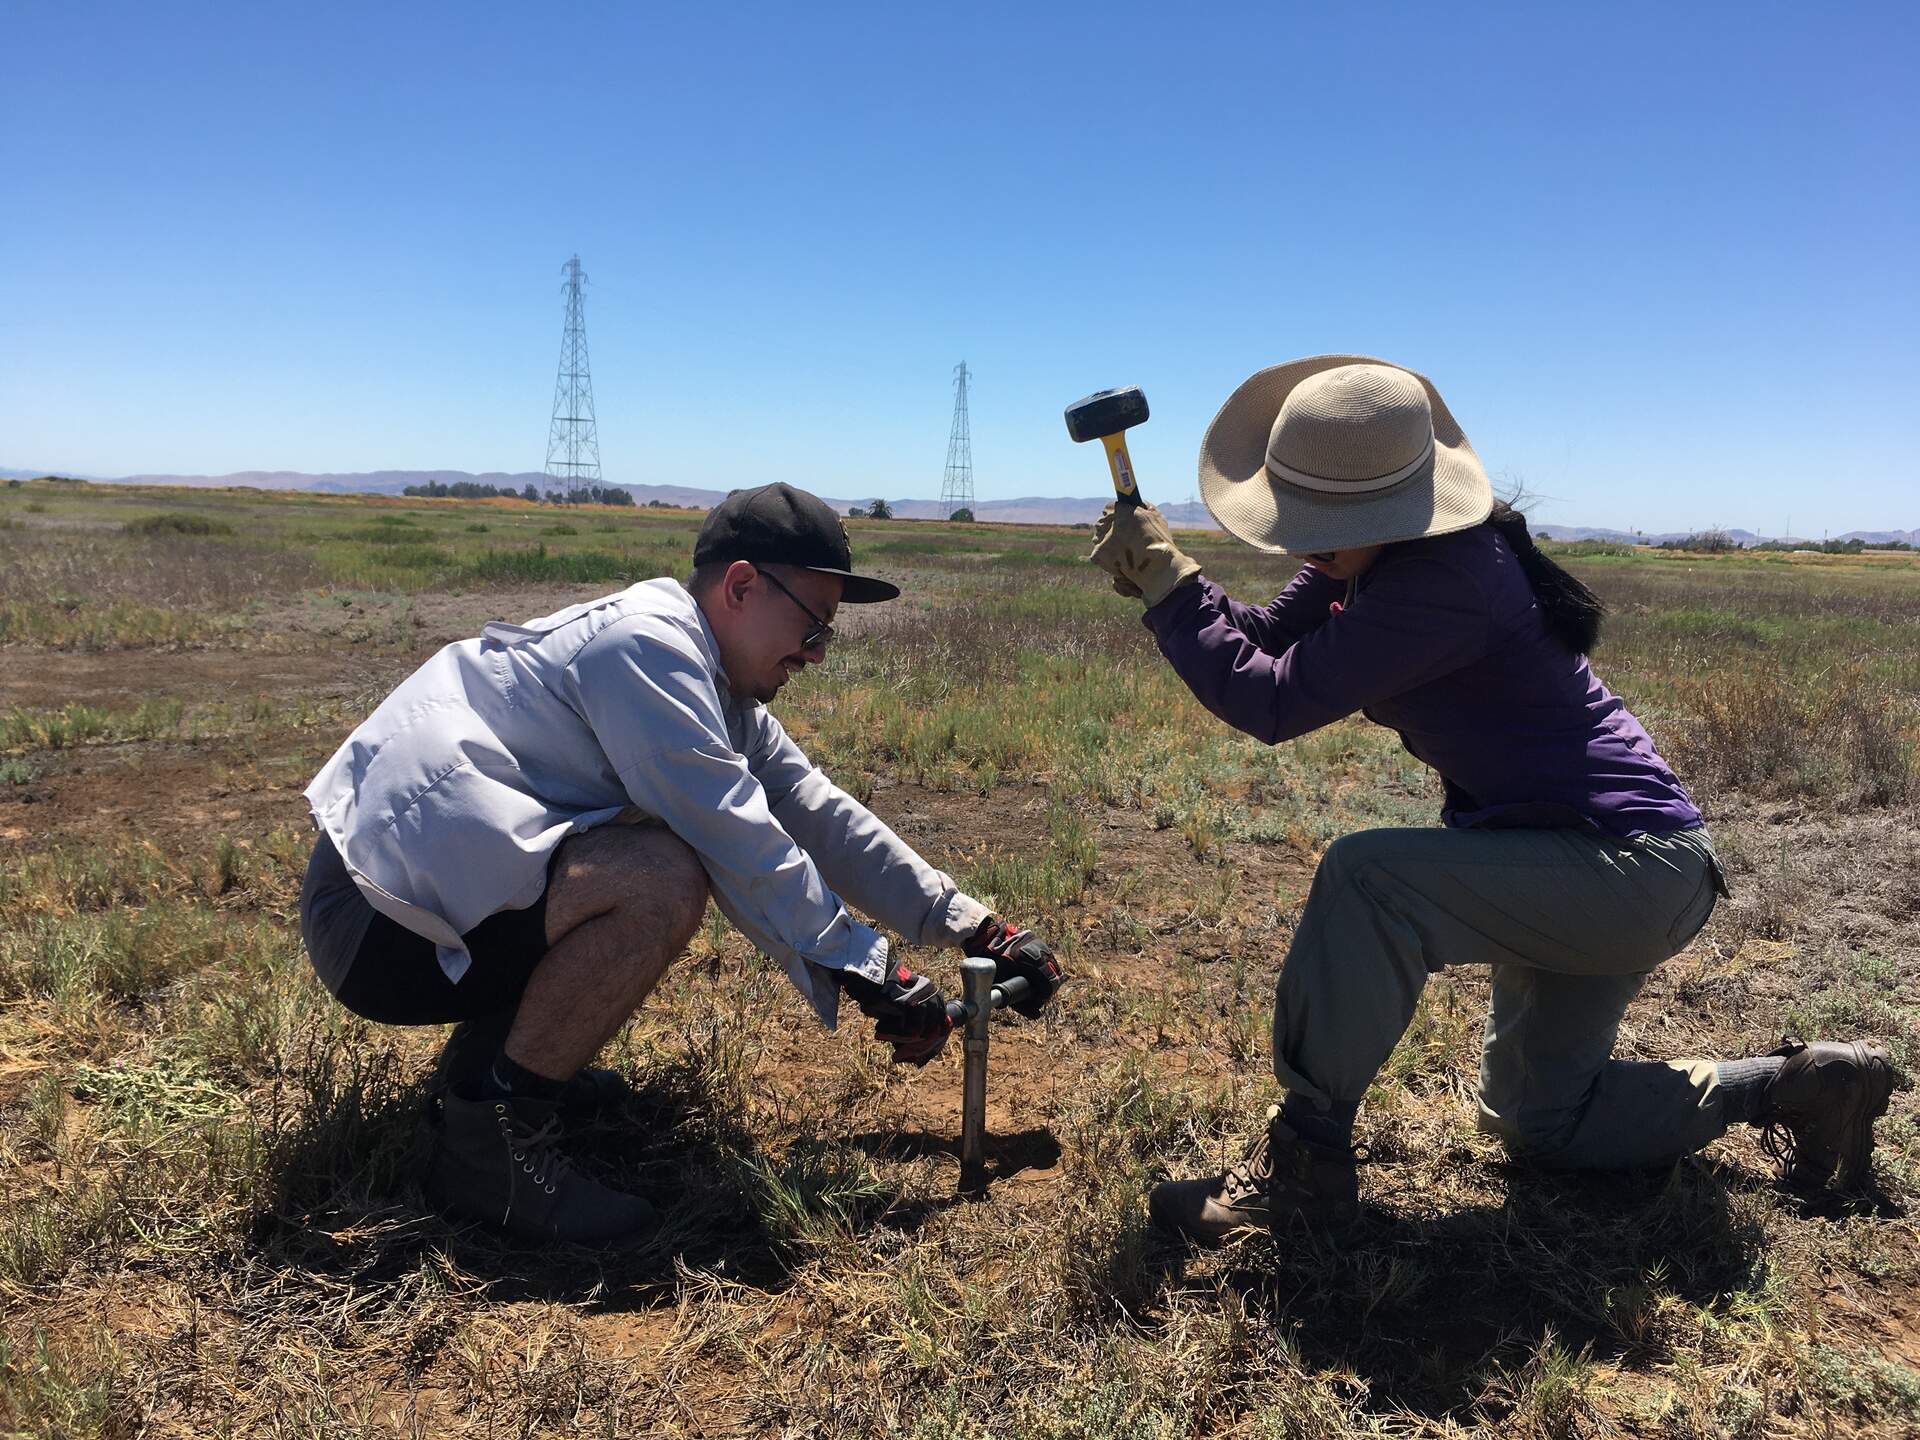
20210707HS_CarlosAri.jpg ( 2021-07-07 16:26:18 ) Full size: 1920x1440
Carlos and Ari taking short (30cm) soil cores at Hill Slough. Carlos's shirt indicates how windy it is that day.

20210707HS_ShortSoilCore.jpg ( 2021-07-07 12:09:29 ) Full size: 1920x1440
Carlos and Ari with a short soil core.
20210709HS_PrefloodSoilCoring.jpg ( 2021-07-09 00:00:00 ) Full size: 1920x1440
Joe, Ari, Daphne, and Carlos taking soil core samples before levee breach and flooding

20210709HS_SoilCoring.jpg ( 2021-07-08 10:45:58 ) Full size: 1920x1440
Dennis, Joe, Ari, and Carlos taking soil core samples before levee breach/flooding. They are in a thick patch of lamb's quarters (or similar plant).
HS_picam_20210707_1215.jpg ( 2021-07-07 12:15:05 ) Full size: 1917x1440
Carlos, Ari, and Daphne sampling soils

HS_picam_20210707_0915.jpg ( 2021-07-07 09:15:05 ) Full size: 1917x1440
Ari and Carlos taking soil samples
4 sets found
21 HS_met graphs found
4 HS_flux graphs found
1 HS_cam graphs found
Can't check HS_Processed
2 HS_Processed graphs found