
Field Notes
<--2021-05-04 00:00:00 | 2021-05-13 14:30:00-->Phenocam link: Searching...
Sherman Wetland: 2021-05-06 00:00:00 (DOY 126)
Author: Camilo Rey-Sanchez
Others: Robert, Julie, Patty
Summary: 2nd round of chamber measurements of CH4 flux in hotspot and open water; LGR calibration
| Robert and I arrived at 9 AM. We met Julie at the main gate shortly after. It was a clear sunny day with a strong breeze, especially in the morning. We prepared the inflatable boat and took some measurements in the open water, around the area of the maximum contribution to the footprint. I also collected some exploratory data on CH4 flux from leaves by combining the Li-6400 with the Li-7810. I just connected the sample tube to the output tube and then the exhaust from the cuvette to the input tube in the Li-7810. I was not sure this was going to work but it did. It is a closed system with a very small volume, which means the concentration of CO2 is depleted rapidly, so individual leaf measurements should not last more than 2 minutes. After this time the CO2 concentration can go down to 350 ppm. I had issues with the batteries I had brought (they were fully charged but apparently are not holding charge enough) so I was not able to collect that many leaves. I still need to analyze the data but it seems like there was only a small amount of CH4 coming out of leaves. We then went to the hotspot around 1 PM, and sample multiple times around the boardwalk with the floating chamber. Then we went about 65 m south to sample an area that I thought to be outside of the hotspot but after entering this open water area it was clear by the bubbles and by the smell that this was also a high CH4 flux area. The data from the floating chamber seemed to confirm this. We also run a short test to see if we can see CH4 emissions from the road, above where the gas pipeline should be. There was a very minute steady increase in CH4 concentration of about 1 ppb per second, which was surprising. I will need to process the data to get the precise magnitude of the flux, but this should transform to about 2 nmol m-2 s-1. We left at 4:30 PM. Patty Notes: Patty arrived 12:30pm. Julie Robert and Camilo already here, working on chamber measurements in footprint. I calibrated LGR with NOAA standard and changed the top inlet filter. Everything looked good. Praxair at 1600 psi CO2 = 426 ppm D13 C = -17.6 per mil D18O=-100 per mil H2O =393ppm gas temperature =44.5 C gas pressure =119.76torr laser response =12.60us Laser adjust looks good= -1.875 NOAA tank is low 700psi-need to order new one Ran praxair again one last time to make sure running properly at 1:28pm, everything looked good. |
5 photos found

20210506SW_Li-6400-CH4.jpg ( 2021-05-06 11:48:05 ) Full size: 1440x1920
Exploratory plant CH4 fluxes by combining the Li-6400 with the Li-7810

20210506SW_Soil_CH4.jpg ( 2021-05-06 15:42:29 ) Full size: 1920x1440
Exploratory measurement of CH4 fluxes in the soil above the gas pipeline
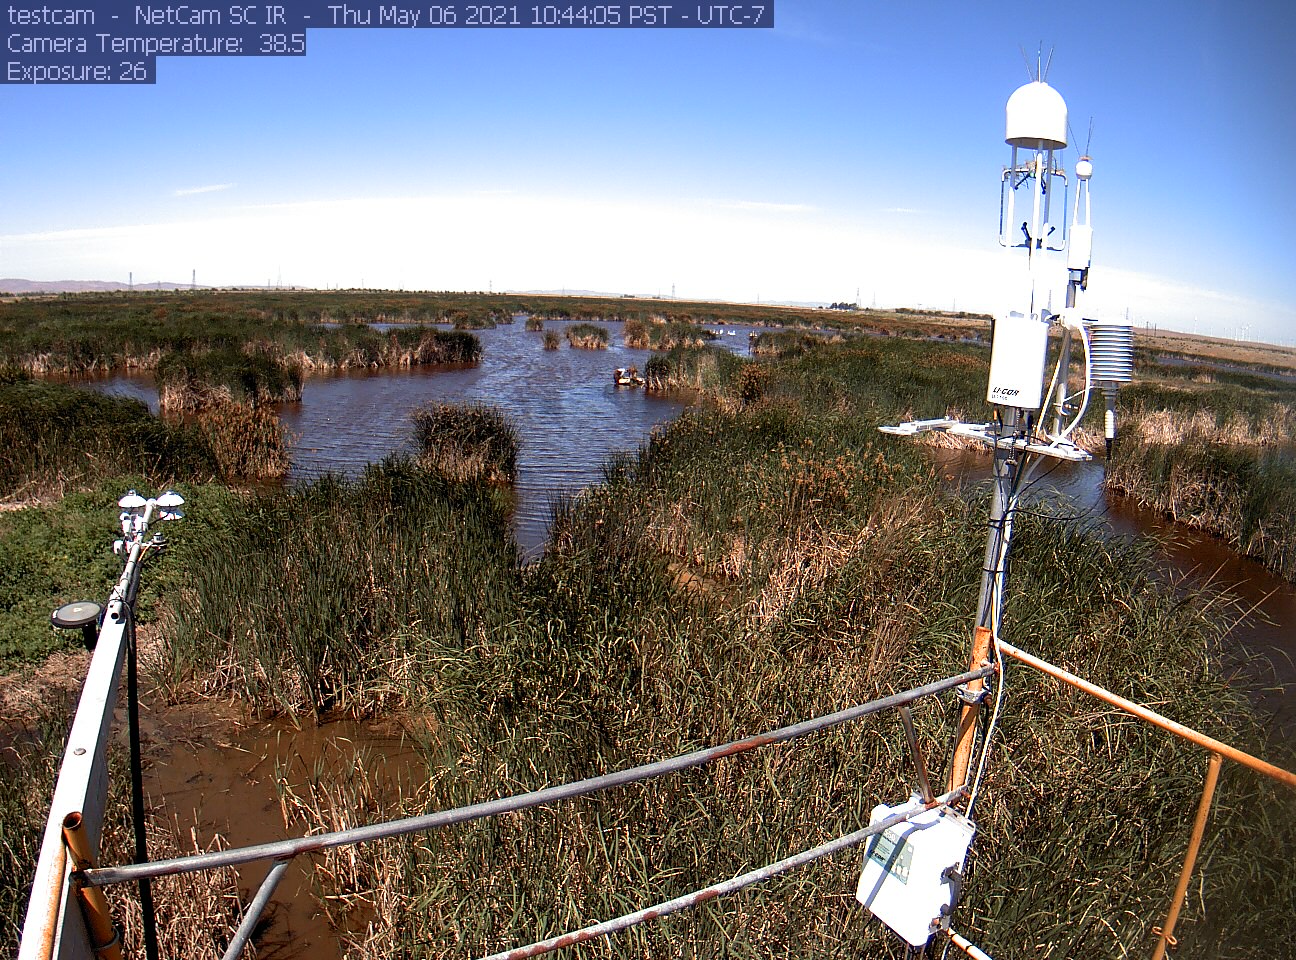
siwetland_2021_05_06_104405.jpg ( 2021-05-06 10:45:56 ) Full size: 1296x960
2nd round of methane hotspot sampling

siwetland_2021_05_06_101405.jpg ( 2021-05-06 10:16:00 ) Full size: 1296x960
2nd round of methane hotspot sampling
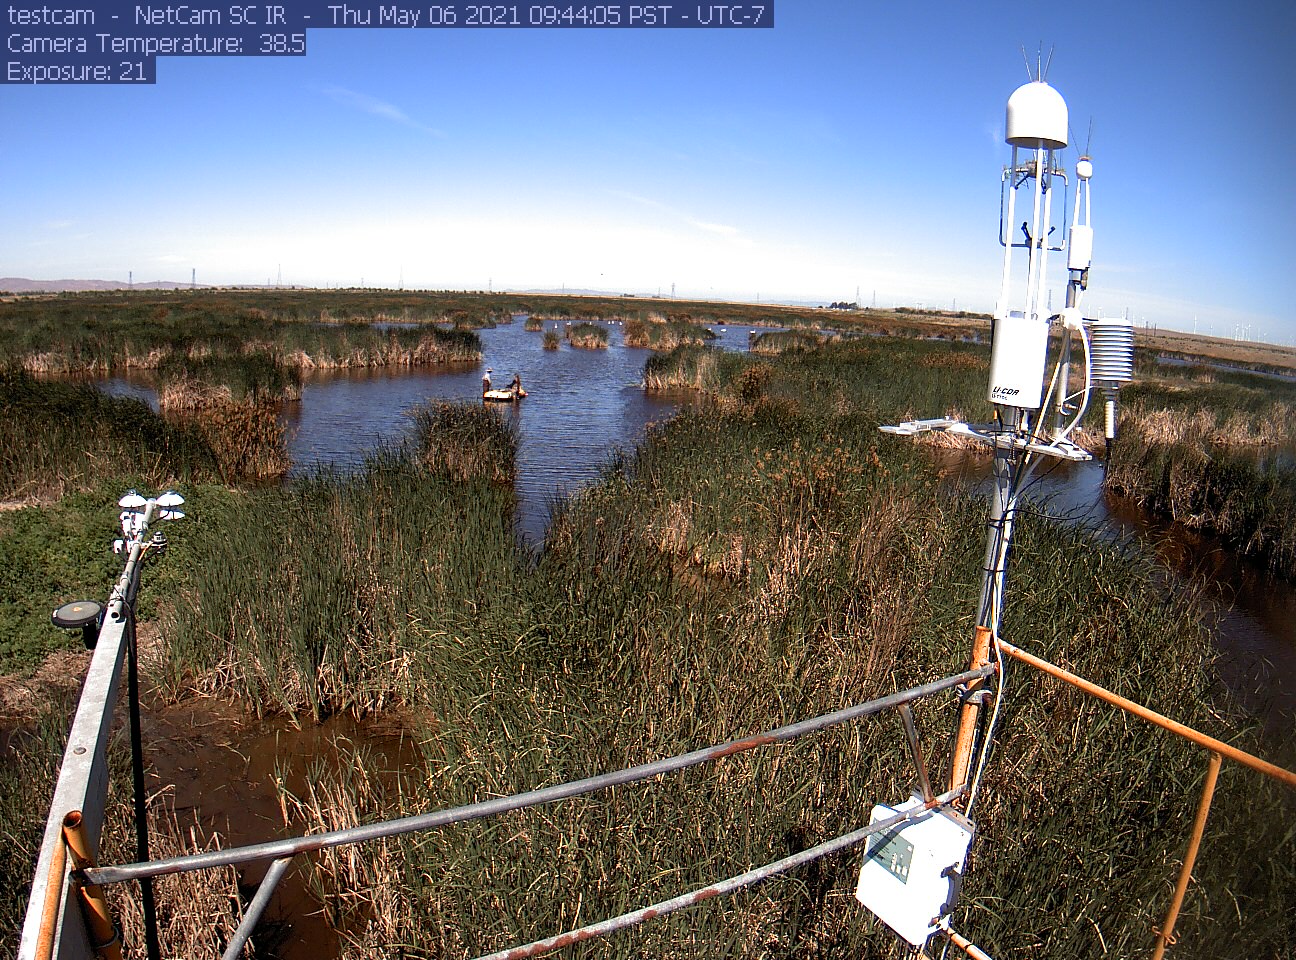
siwetland_2021_05_06_094405.jpg ( 2021-05-06 09:46:14 ) Full size: 1296x960
2nd round of hotspot sampling
7 sets found
Can't check MBWPEESWGT_mixed
Can't check MBEEWPSWEPGT_cam
16 SW_met graphs found
4 SW_flux graphs found
Can't check MBSWEEWPBCBA
Can't check SW_Temp
14 SW_Temp graphs found
3 SW_arable graphs found