
Field Notes
<--2021-04-27 15:55:00 | 2021-05-06 00:00:00-->Other sites visited today: Bouldin Alfalfa | Tonzi | Vaira
Phenocam link: Searching...
Sherman Wetland: 2021-05-04 00:00:00 (DOY 124)
Author: Camilo Rey-Sanchez
Others: Ariane
Summary: Extracting cores for microbial analysis at the hotspot and open water
| Ariane and I arrived at 9:30 AM. It was a sunny and hot day with a clear view of Mount Diablo. We went to the hotspot and extracted 3 cores. The label for this spot was "SWHS". The cores were taken around the small boardwalk. Core # 1 was taken further west towards the berm, core #2 towards the center, and core #3 past the boardwalk in an area that had no standing water. Although we tried to get 40-50 cm of sediment, we could only get ~25 cm at a time because the vacuum was not enough and the bottom part of the sediment column was lost during extraction. For those times where the deeper layer was not accessible, we used the "hammer corer" which has a smaller area but can sample a large enough volume for our samples. The cores were split into sections of 0-5 cm, 5-10 cm, 10-15cm, 20-25 cm, 20-30 cm, 30-40 cm with some slight modifications. We took one sample for bulk density across all depths of 10 ml of volume, using a 25 ml syringe as a mini-corer; at least 50 g (wet weight) of sediment for microbial analysis, and 100 g for elemental analysis. Microbial samples were immediately put in the cooler with dry ice, and the other samples were put in a larger cooler with regular ice. At around 1 PM we went to the open water area closer to the tower, where the area of the maximum contribution to the footprint lies. We repeated the same procedure. The label for this area was "SWO". Core # 1 was taken farther west, core # 2 in the middle, close to where the sed points were installed previously, and core # 3 further east closer to the tower. The distance between cores was about 5 m. We left around 3 PM and went to the lab where we put the microbial samples on a fridge in the second floor at -80 deg C. I weighed the samples for calculation of bulk density and then put them in the oven to dry at 60 deg C. Ariane prepared the labels and documentation for the shipping of the samples to Kuno the next day. We left the lab at around 6:00 PM. |
5 photos found
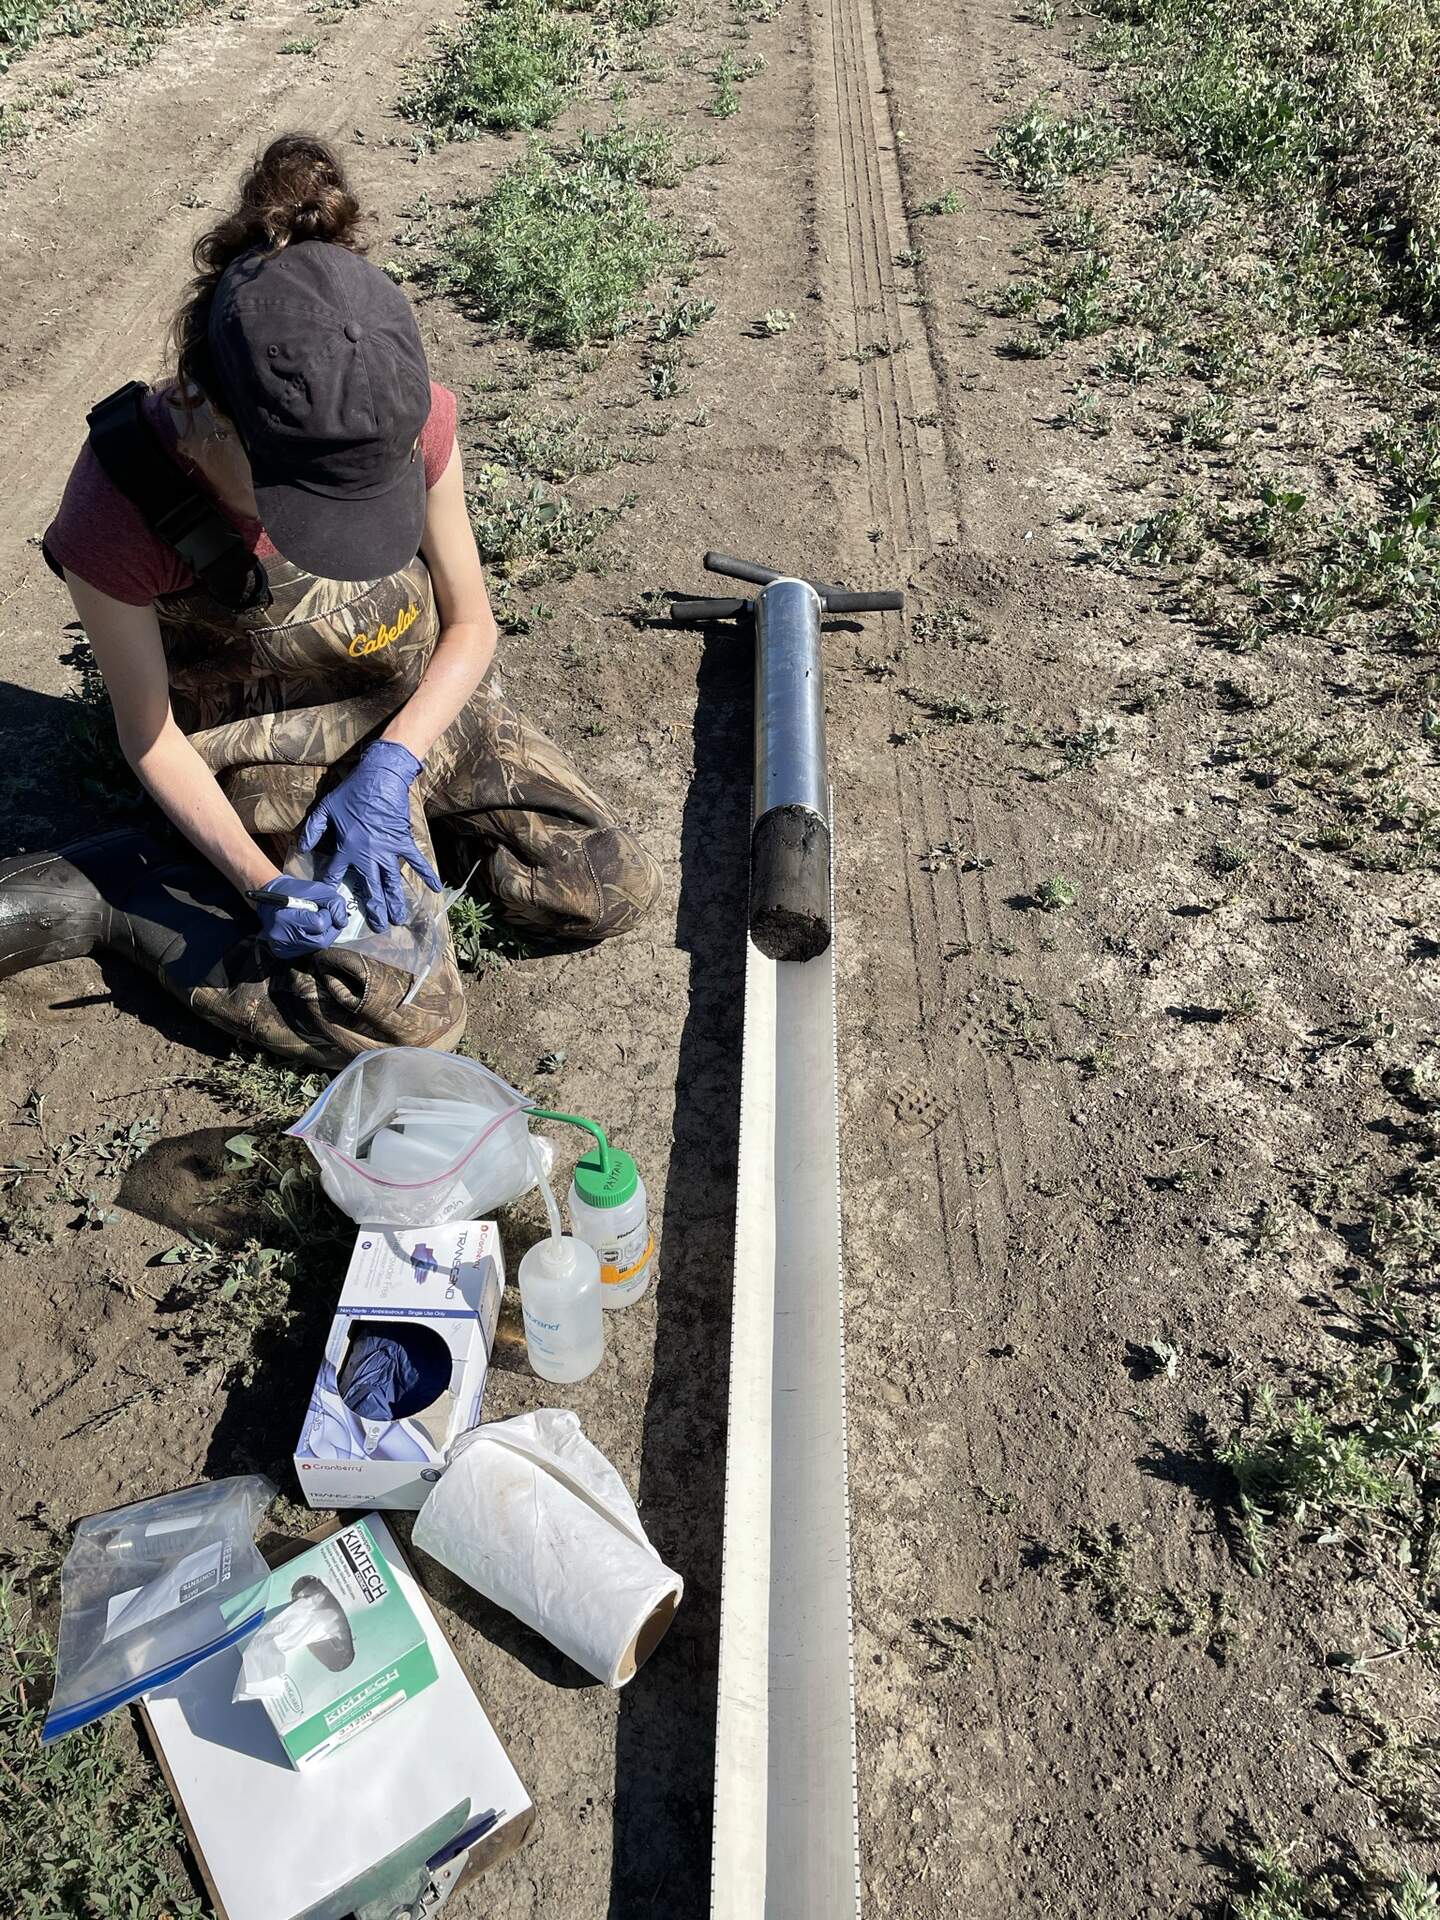
20210504SW_Hotspot_core.jpg ( 2021-05-04 09:37:22 ) Full size: 1440x1920
Soil core sampling at the hotspot

20210504SW_Hotspot_core2.jpg ( 2021-05-04 09:37:29 ) Full size: 1440x1920
Detail of the Soil core sampling at the hotspot
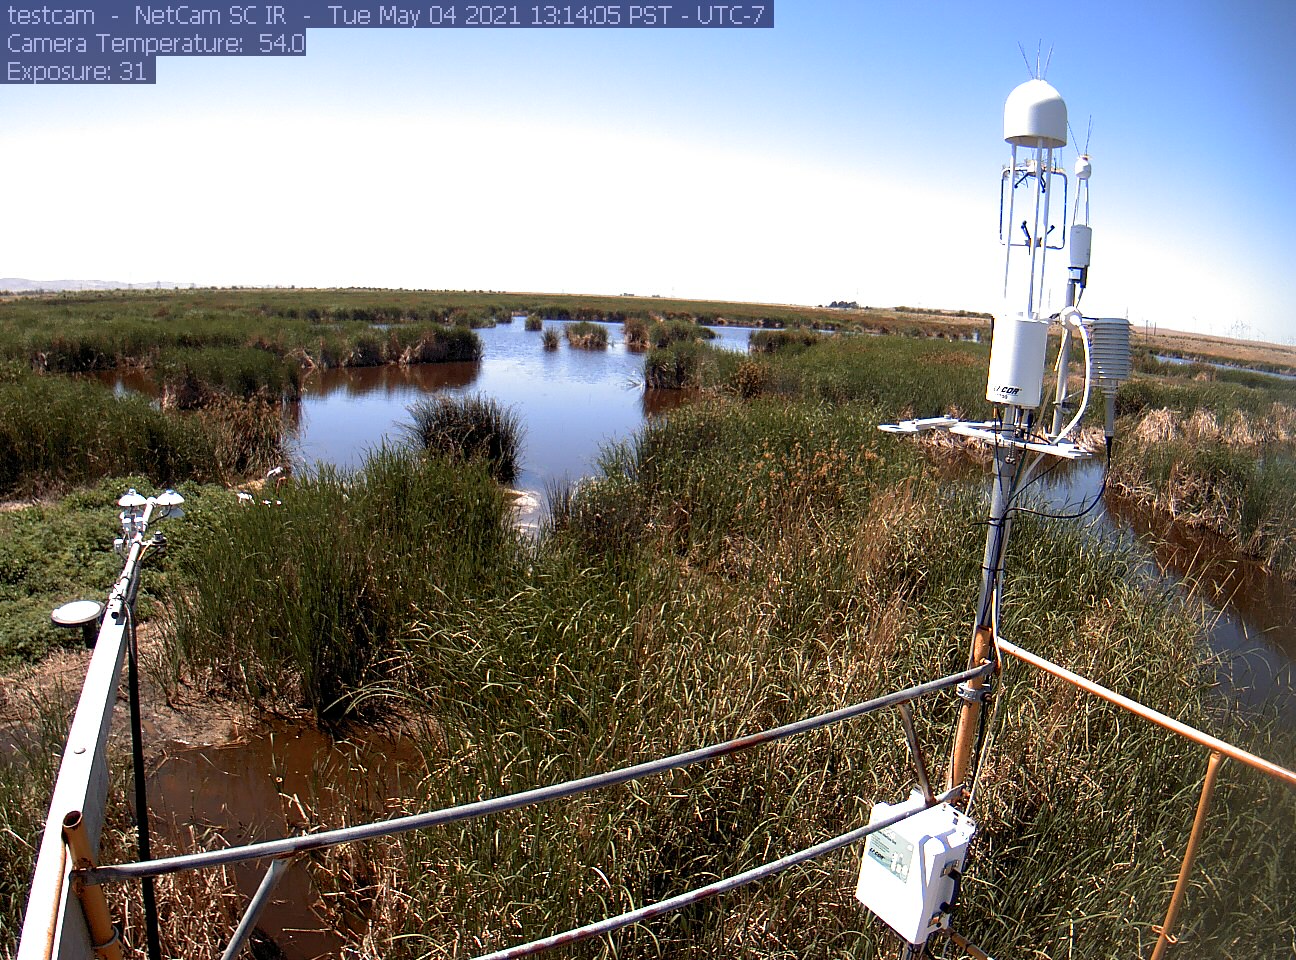
siwetland_2021_05_04_131405.jpg ( 2021-05-04 13:15:52 ) Full size: 1296x960
2nd round of methane hotspot sampling
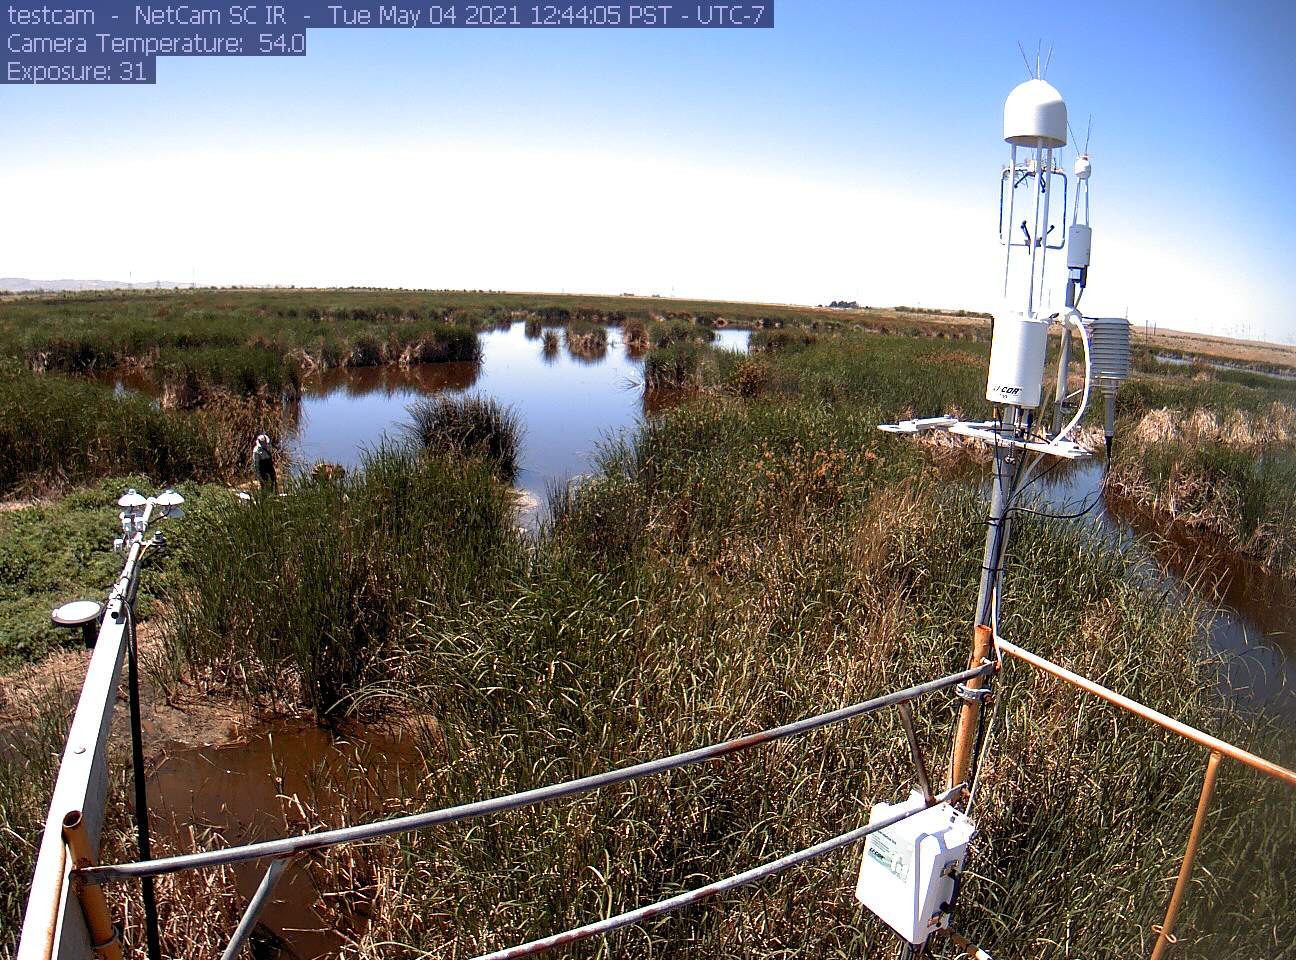
siwetland_2021_05_04_124405.jpg ( 2021-05-04 12:45:56 ) Full size: 1296x960
2nd round of methane hotspot sampling
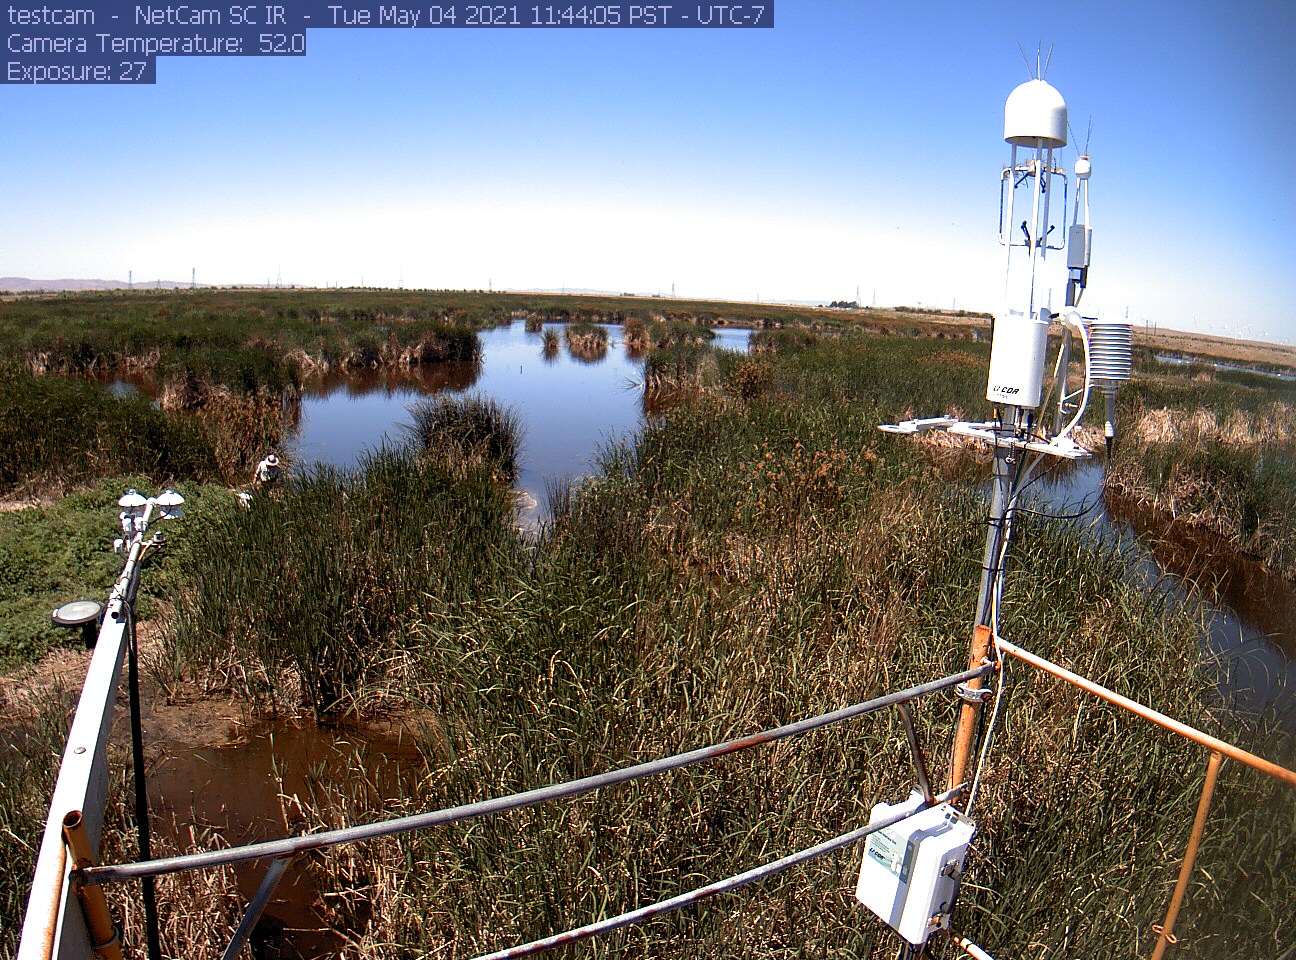
siwetland_2021_05_04_114405.jpg ( 2021-05-04 11:45:50 ) Full size: 1296x960
2nd round of methane hotspot sampling
7 sets found
Can't check MBWPEESWGT_mixed
Can't check MBEEWPSWEPGT_cam
16 SW_met graphs found
4 SW_flux graphs found
Can't check MBSWEEWPBCBA
Can't check SW_Temp
14 SW_Temp graphs found
3 SW_arable graphs found