Field Notes

<--2021-05-06 00:00:00 | 2021-05-18 15:40:00-->
Other sites visited today: Hill Slough | Bouldin Corn | Bouldin Alfalfa | West Pond | East End | Mayberry

Sherman Wetland: 2021-05-13 14:30:00 (DOY 133)
Author: Daphne Szutu
Others: Joe

Summary: Regular data collection/cleaning, started sonic intercomparison again, conductivity sensor was out of water--lowered

2021-05-13
Sherman Wetland

Joe and I arrived at 14:30 PDT. It was super windy. The staff gauge read 85.5 cm. There was a dead pelican with a broken wing on the levee road just past the boardwalk entrance.

I downloaded met, camera, USB GHG and miniDOT data. I swapped miniDOT and water level sensor desiccants. Joe cleaned flux and rad sensors. The wash reservoir was 90% full; we topped it off.

We added the sonic intercomparison sn 153805 again after Joe repinned the cable in the lab. The heading is the same as the permanent sonic: 17 deg true N. I added 4 aux columns to the 7700 GHG column output. The aux coefficients were still saved from last time. We compared u, v, w, sos on both sonics and they matched reasonably well.

The conductivity sensor was out of the water; I lowered it back in.

LI-7500 readings:
CO2 406ppm
H2O 609ppm
T 21.6C
P 101.4kPa
SS 97--> 98 after cleaning
LI7700 readings:
CH4 1.98ppm
RSSI 34--> 71 after cleaning

We left around 14:55 PDT.

1 photos found

Grackle
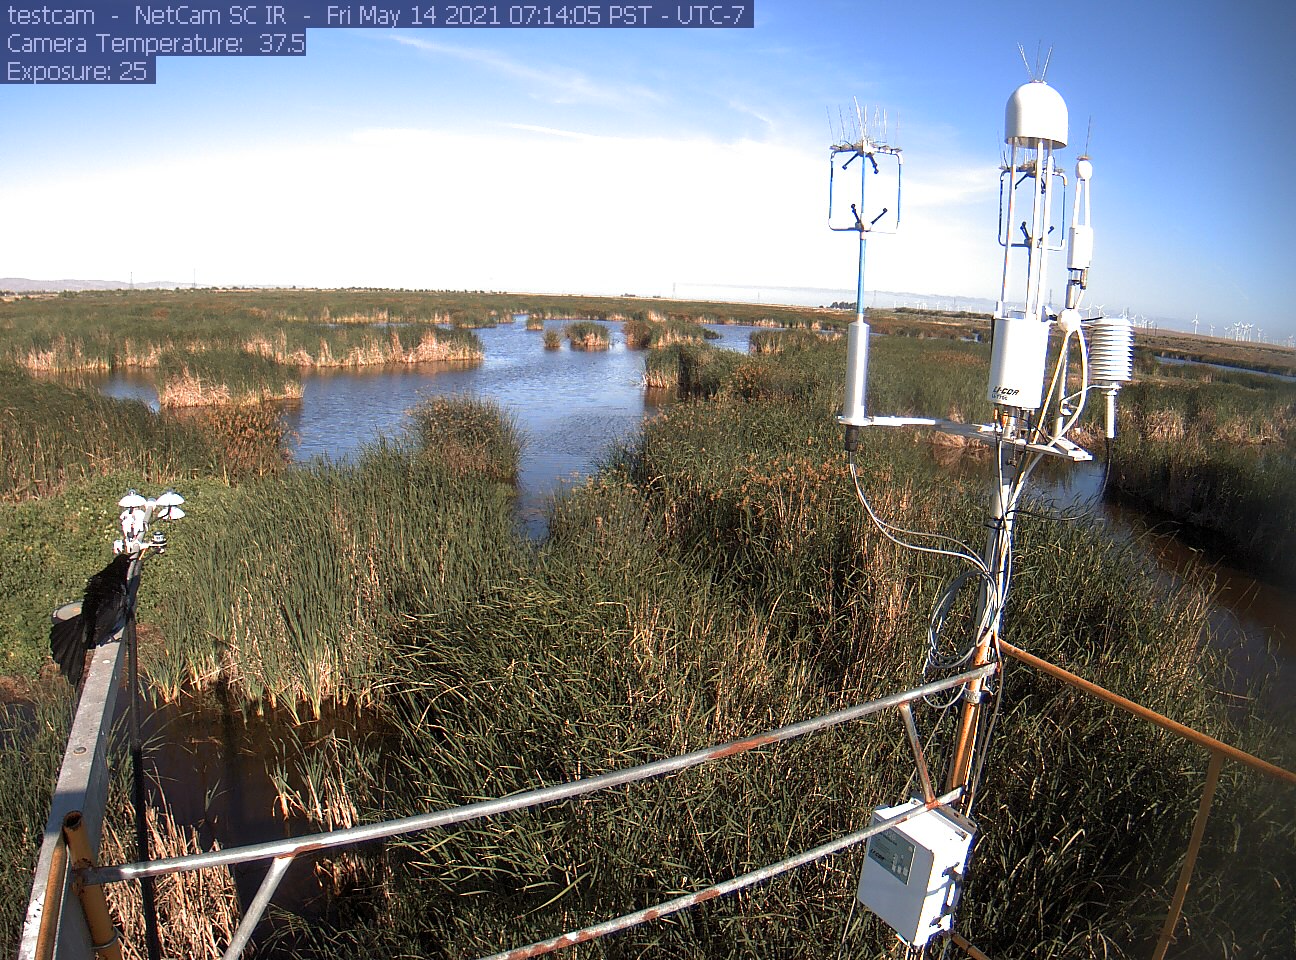
siwetland_2021_05_14_071405.jpg ( 2021-05-14 07:16:00 ) Full size: 1296x960
Grackle

Graphs display:
7 sets found

Can't check MBWPEESWGT_mixed
Can't check MBEEWPSWEPGT_cam
16 SW_met graphs found

Explore the graph:Temperatures in a new window

Explore the graph:Water Temperature Profile A in a new window

Explore the graph:Water Temperature Profile B in a new window

Explore the graph:Soil Temperature Profile C2 in a new window

Explore the graph:Soil Heat Flux in a new window

Explore the graph:Four channel Radiometer in a new window

Explore the graph:Sherman Wetland PAR in a new window

Explore the graph:PRI Channels in a new window

Explore the graph:NDVI Channels in a new window

Explore the graph:Water level and Rain in a new window

Explore the graph:Dissolved CO2 in a new window

Explore the graph:Air Pressure in a new window

Explore the graph:Battery Voltage and RH in a new window

Explore the graph:Soil Temperature Profile C1 in a new window

Explore the graph:SRS NDVI and PRI in a new window

Explore the graph:SW miniDOT Dissolved Oxygen in a new window

4 SW_flux graphs found

Explore the graph:CO2 and H2O in a new window

Explore the graph:Wind in a new window

Explore the graph:Methane in a new window

Explore the graph:Data Counts in a new window

Can't check MBSWEEWPBCBA
Can't check SW_Temp
14 SW_Temp graphs found

Explore the graph:Temperatures in a new window

Explore the graph:CO2 and H2O in a new window

Explore the graph:Wind in a new window

Explore the graph:Methane in a new window

Explore the graph:Data Counts in a new window

Explore the graph:Temperature Profile A in a new window

Explore the graph:Temperature Profile B in a new window

Explore the graph:Temperature Profile C in a new window

Explore the graph:Soil Heat Flux in a new window

Explore the graph:Four-channel radiometer in a new window

Explore the graph:NDVI Channels in a new window

Explore the graph:PAR in a new window

Explore the graph:Air Pressure and Water Level in a new window

Explore the graph:Air T and RH in a new window

3 SW_arable graphs found

Explore the graph:Incoming Solar Bands in a new window

Explore the graph:Reflected Solar Bands in a new window

Explore the graph:Solar Radiation in a new window