Field Notes

<--2021-04-08 00:00:00 | 2021-04-15 09:30:00-->

Sherman Wetland: 2021-04-14 12:30:00 (DOY 104)
Author: Patty Oikawa
Others:

Summary: LGR maintenance, installed new praxair cylinder

12:30pm arrival
Installed new Praxair CO2 tank from the Berkeley lab
Changed program back to sample cal gas for 300 seconds 1x per day
New Praxair:
CO2 = 442.90 ppm
D13 C = -53.4 per mil
D18O= -154.17 per mil
H2O= 549.9 ppm--*looks high
Gas temperature =44.5 Celsius
gas pressure=119.77 torr
laser response =12.79 µs

Reference gas main stage 18,00 psi secondary stage 24 psi
*Remember with this regulator in the field = lefty close, righty open
Laser adjustment looks OK
tower readings:
CO2 for 428ppm
delta 13 C -27.98
Delta 180-153.75
water vapor 1967.8ppm
Water is definitely reading high -not sure why --we could try replacing the dryrite
perhaps some water got into the laser
Need to calibrate with NOAA standard asap

7 photos found

Camilo, Ari, and Julie sampling open water location
siwetland_2021_04_15_094405.jpg ( 2021-04-15 09:45:36 ) Full size: 1296x960
Camilo, Ari, and Julie sampling open water location

Inflatable raft used during methane hotspot sampling
siwetland_2021_04_15_091405.jpg ( 2021-04-15 09:15:38 ) Full size: 1296x960
Inflatable raft used during methane hotspot sampling

Patty on site
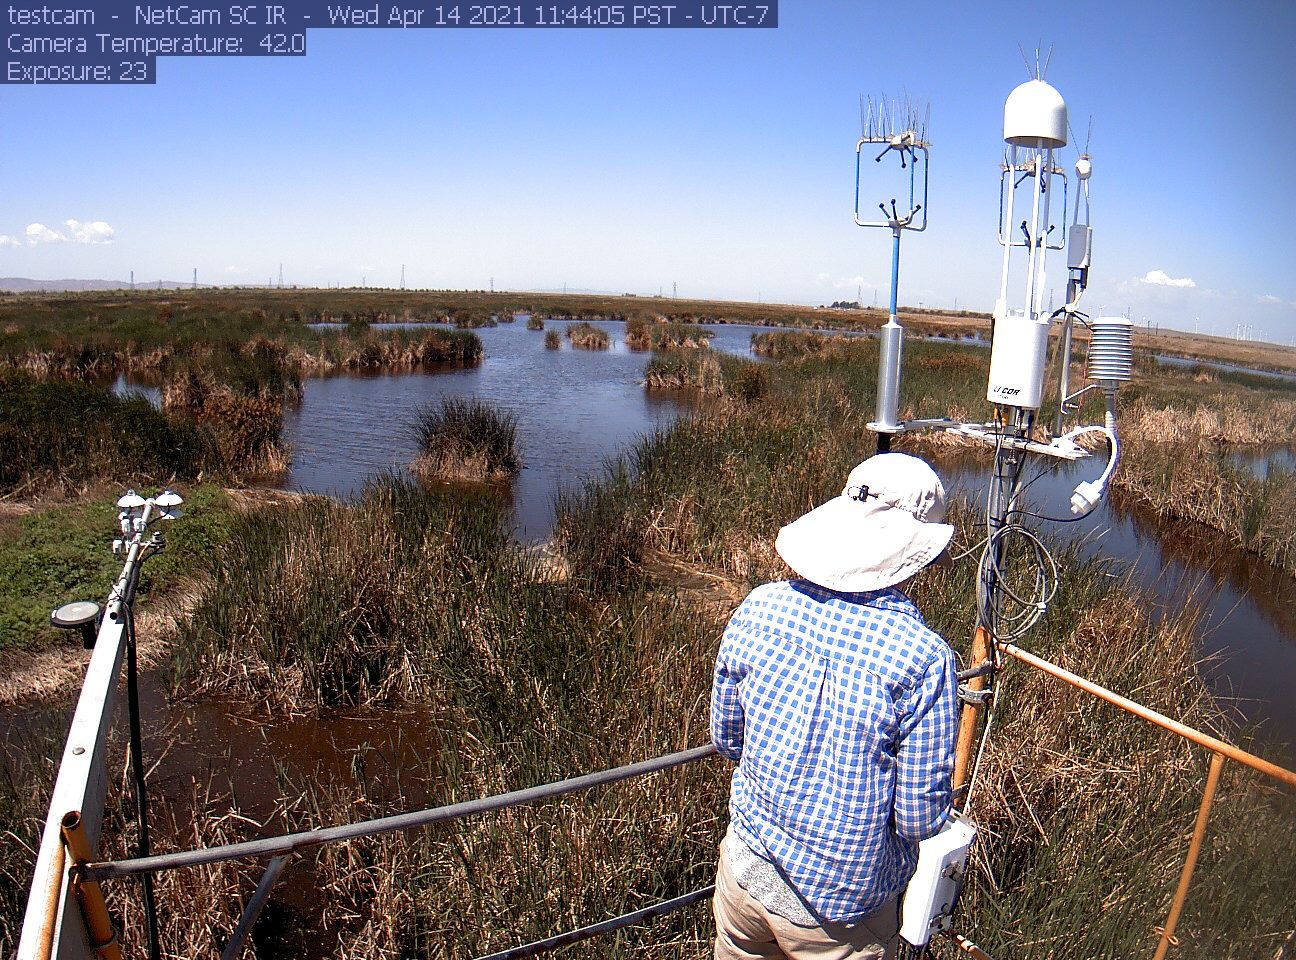
siwetland_2021_04_14_114405.jpg ( 2021-04-14 11:45:46 ) Full size: 1296x960
Patty on site

Methane hotspot sampling
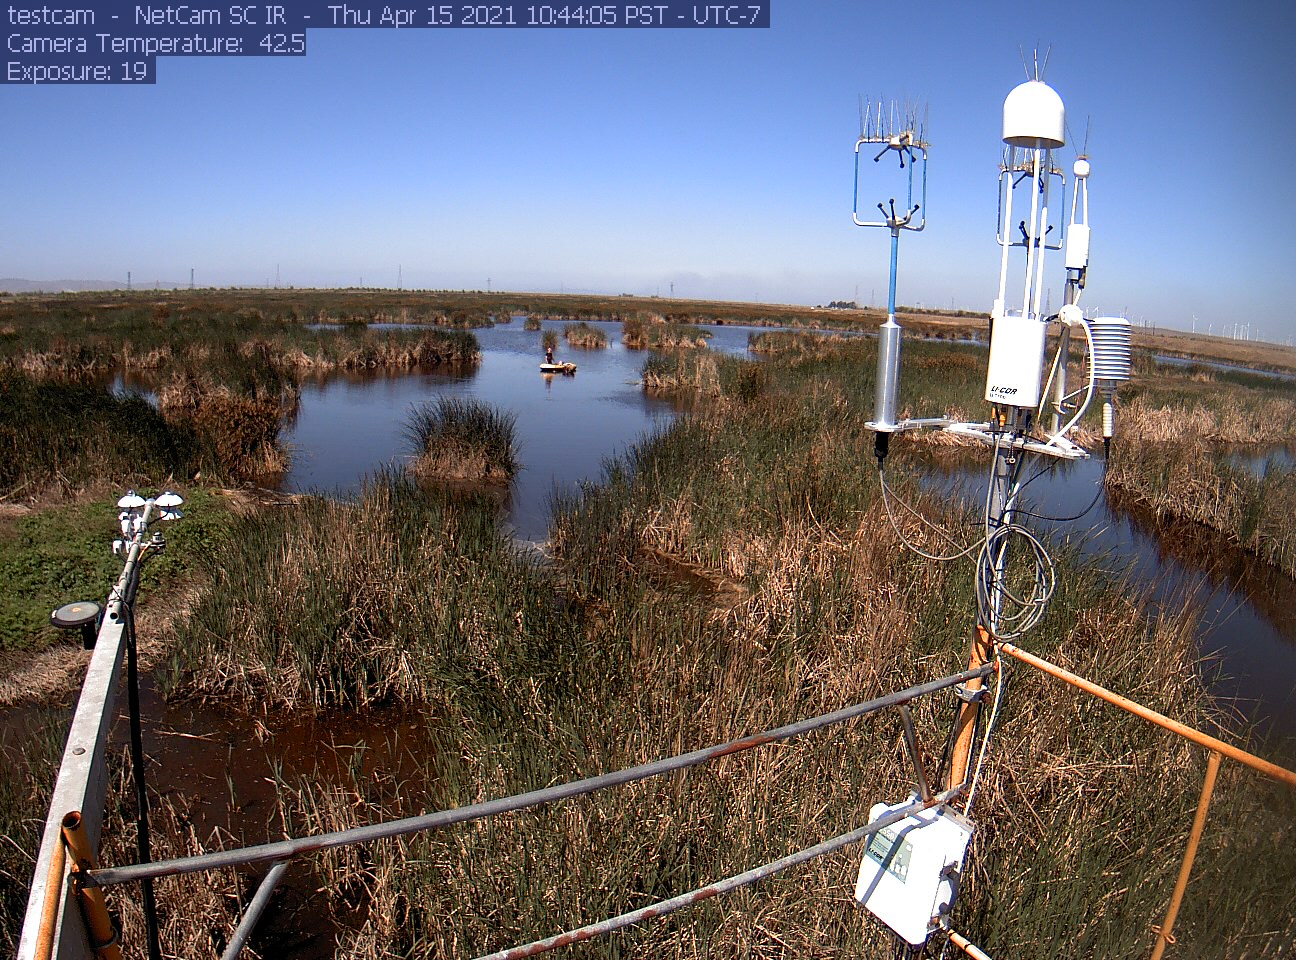
siwetland_2021_04_15_104405.jpg ( 2021-04-15 10:45:38 ) Full size: 1296x960
Methane hotspot sampling

Methane hot spot sampling
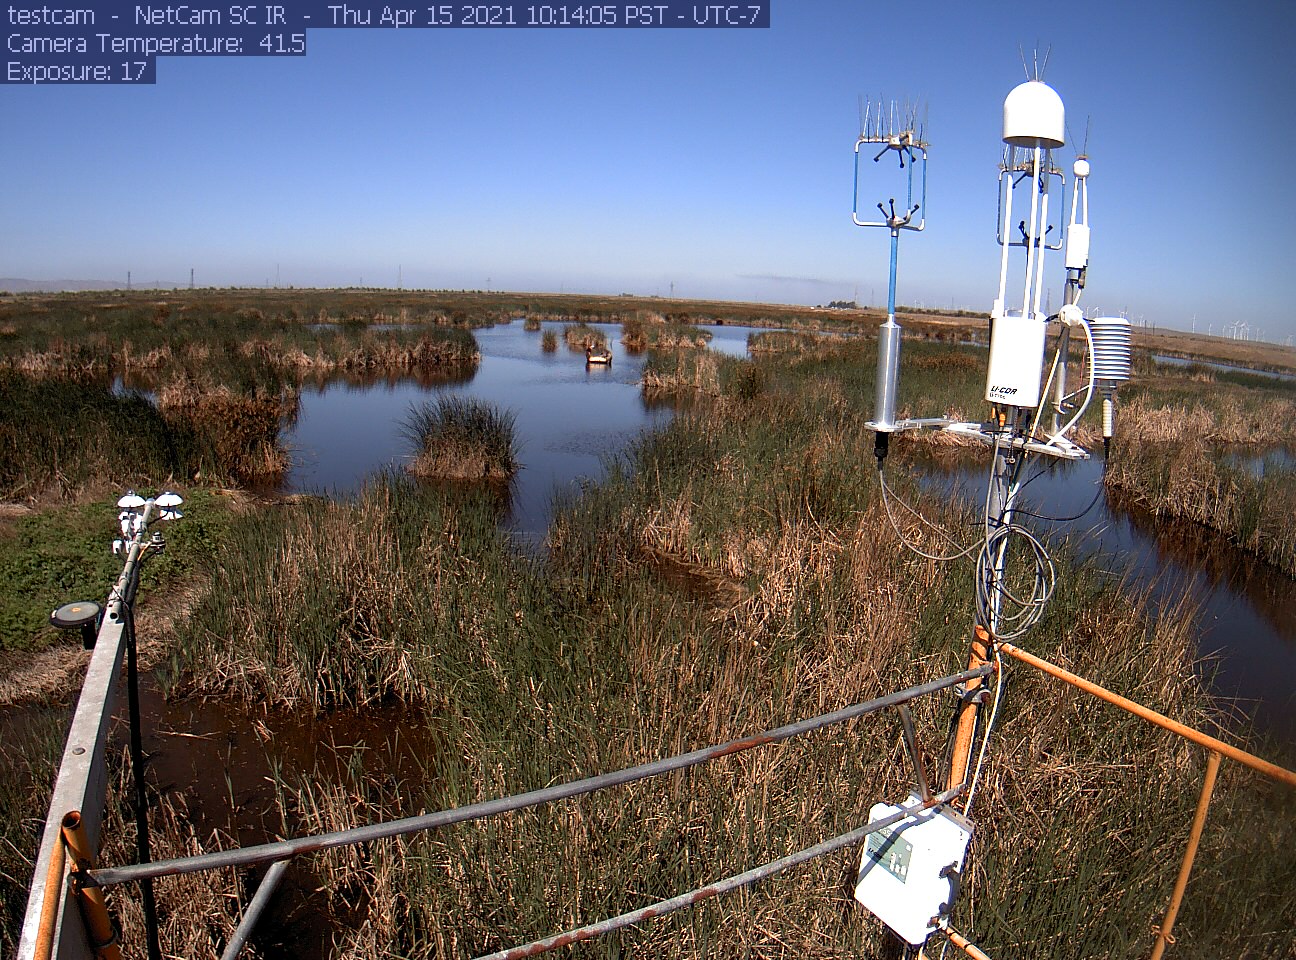
siwetland_2021_04_15_101405.jpg ( 2021-04-15 10:15:48 ) Full size: 1296x960
Methane hot spot sampling

Methane hotspot sampling
siwetland_2021_04_15_114405.jpg ( 2021-04-15 11:45:38 ) Full size: 1296x960
Methane hotspot sampling

Methane hotspot sampling
siwetland_2021_04_15_111405.jpg ( 2021-04-15 11:15:46 ) Full size: 1296x960
Methane hotspot sampling

Graphs display:
7 sets found

Can't check MBWPEESWGT_mixed
Can't check MBEEWPSWEPGT_cam
16 SW_met graphs found

Explore the graph:Temperatures in a new window

Explore the graph:Water Temperature Profile A in a new window

Explore the graph:Water Temperature Profile B in a new window

Explore the graph:Soil Temperature Profile C2 in a new window

Explore the graph:Soil Heat Flux in a new window

Explore the graph:Four channel Radiometer in a new window

Explore the graph:Sherman Wetland PAR in a new window

Explore the graph:PRI Channels in a new window

Explore the graph:NDVI Channels in a new window

Explore the graph:Water level and Rain in a new window

Explore the graph:Dissolved CO2 in a new window

Explore the graph:Air Pressure in a new window

Explore the graph:Battery Voltage and RH in a new window

Explore the graph:Soil Temperature Profile C1 in a new window

Explore the graph:SRS NDVI and PRI in a new window

Explore the graph:SW miniDOT Dissolved Oxygen in a new window

4 SW_flux graphs found

Explore the graph:CO2 and H2O in a new window

Explore the graph:Wind in a new window

Explore the graph:Methane in a new window

Explore the graph:Data Counts in a new window

Can't check MBSWEEWPBCBA
Can't check SW_Temp
14 SW_Temp graphs found

Explore the graph:Temperatures in a new window

Explore the graph:CO2 and H2O in a new window

Explore the graph:Wind in a new window

Explore the graph:Methane in a new window

Explore the graph:Data Counts in a new window

Explore the graph:Temperature Profile A in a new window

Explore the graph:Temperature Profile B in a new window

Explore the graph:Temperature Profile C in a new window

Explore the graph:Soil Heat Flux in a new window

Explore the graph:Four-channel radiometer in a new window

Explore the graph:NDVI Channels in a new window

Explore the graph:PAR in a new window

Explore the graph:Air Pressure and Water Level in a new window

Explore the graph:Air T and RH in a new window

3 SW_arable graphs found

Explore the graph:Incoming Solar Bands in a new window

Explore the graph:Reflected Solar Bands in a new window

Explore the graph:Solar Radiation in a new window