Field Notes

<--2021-02-04 09:45:00 | 2021-02-26 11:00:00-->
Other sites visited today: Bouldin Alfalfa | Bouldin Corn | East End | West Pond | Mayberry

Sherman Wetland: 2021-02-18 08:50:00 (DOY 49)
Author: Daphne Szutu
Others: Carlos

Summary: Regular data collection/cleaning, calm and mild day, iPad LIDAR scans of tower

2021-02-18
Sherman Wetland

Carlos and I arrived around 8:50 PST. It was a mild, calm and partly cloudy day—perfect weather for Carlos’s first trip to the Delta field sites. The staff gauge read 100 cm. A large flock of white geese passed overhead.

I downloaded met, camera, and USB GHG data. I forgot to bring a replacement CF card so I moved the camera card files onto the laptop and then reinserted the blank card. Carlos cleaned flux and rad sensors. The wash reservoir was 10% empty; we refilled it. I left a prophylactic mothball in the met datalogger box.

Carlos used his iPad to take some LIDAR shots of the tower.

LI-7500 readings:
CO2 434ppm
H2O 243ppm
T 14.3C
P 102.8kPa
SS 108--> 108 after cleaning
LI7700 readings:
CH4 2.0ppm
RSSI 57--> 81 after cleaning

We left around 10:30 PST.

4 photos found

Ipad LIDAR scan of Sherman Wetland tower
20210218SW_IpadLidar.jpg ( 2021-02-18 00:00:00 ) Full size: 700x800
Ipad LIDAR scan of Sherman Wetland tower

Panoramic of Sherman Wetland site with brown plants, calm water, and ice halo around sun.
20210218SW_pano.jpg ( 2021-02-18 00:00:00 ) Full size: 1920x667
Panoramic of Sherman Wetland site with brown plants, calm water, and ice halo around sun.

Carlos
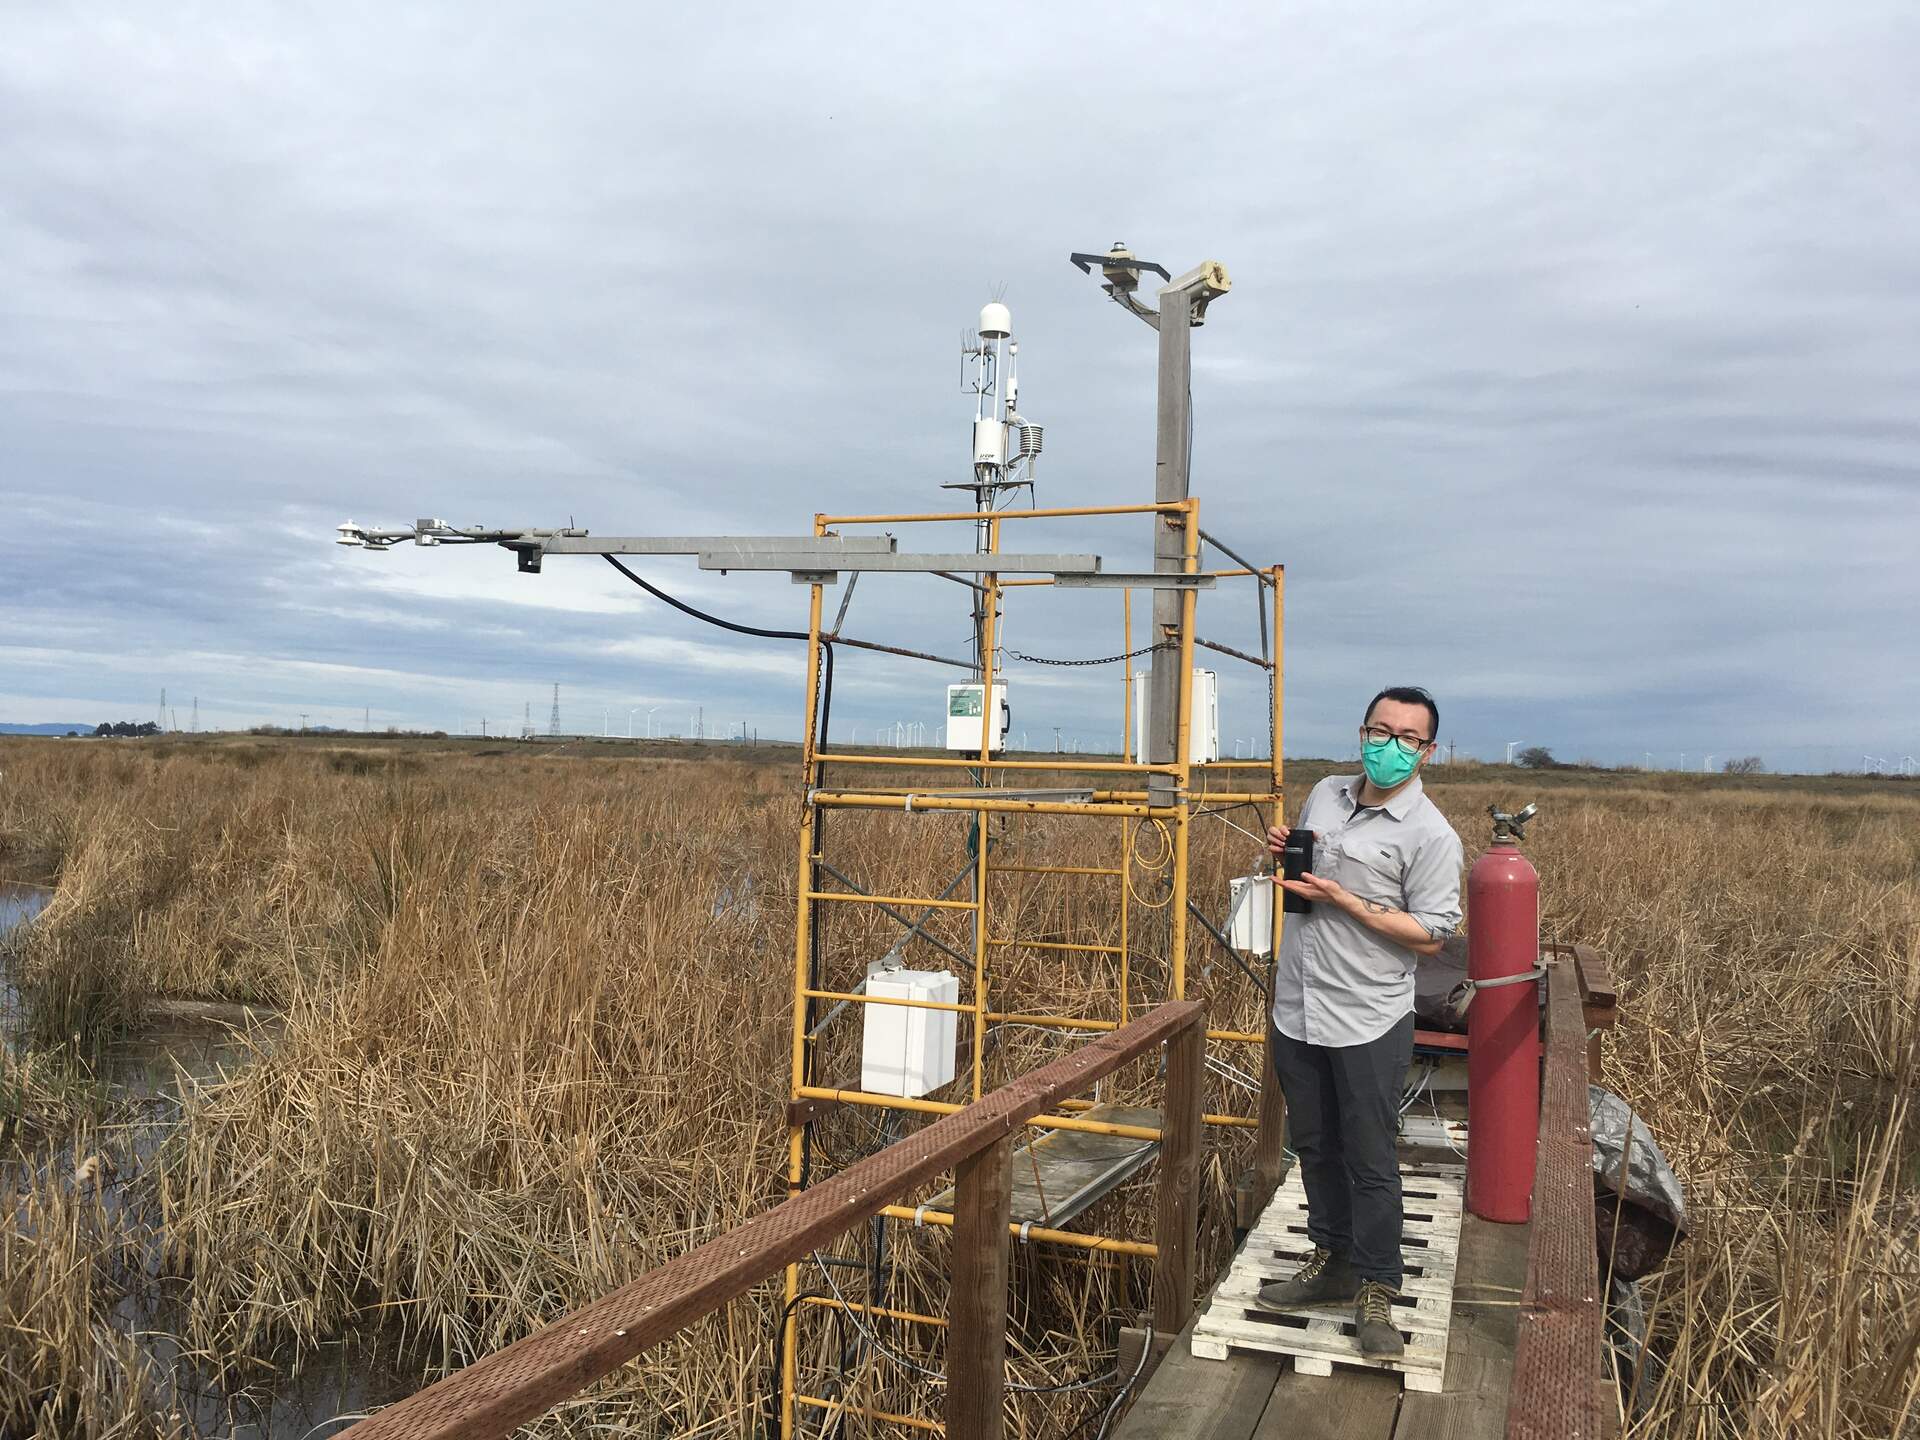
20210218SW_Carlos.jpg ( 2021-02-18 10:09:25 ) Full size: 1920x1440
Carlos's first visit to the Delta sites

Bird balancing on bird spike
siwetland_2021_02_17_081405.jpg ( 2021-02-17 08:18:50 ) Full size: 1296x960
Bird balancing on bird spike

Graphs display:
7 sets found

Can't check MBWPEESWGT_mixed
Can't check MBEEWPSWEPGT_cam
16 SW_met graphs found

Explore the graph:Temperatures in a new window

Explore the graph:Water Temperature Profile A in a new window

Explore the graph:Water Temperature Profile B in a new window

Explore the graph:Soil Temperature Profile C2 in a new window

Explore the graph:Soil Heat Flux in a new window

Explore the graph:Four channel Radiometer in a new window

Explore the graph:Sherman Wetland PAR in a new window

Explore the graph:PRI Channels in a new window

Explore the graph:NDVI Channels in a new window

Explore the graph:Water level and Rain in a new window

Explore the graph:Dissolved CO2 in a new window

Explore the graph:Air Pressure in a new window

Explore the graph:Battery Voltage and RH in a new window

Explore the graph:Soil Temperature Profile C1 in a new window

Explore the graph:SRS NDVI and PRI in a new window

Explore the graph:SW miniDOT Dissolved Oxygen in a new window

4 SW_flux graphs found

Explore the graph:CO2 and H2O in a new window

Explore the graph:Wind in a new window

Explore the graph:Methane in a new window

Explore the graph:Data Counts in a new window

Can't check MBSWEEWPBCBA
Can't check SW_Temp
14 SW_Temp graphs found

Explore the graph:Temperatures in a new window

Explore the graph:CO2 and H2O in a new window

Explore the graph:Wind in a new window

Explore the graph:Methane in a new window

Explore the graph:Data Counts in a new window

Explore the graph:Temperature Profile A in a new window

Explore the graph:Temperature Profile B in a new window

Explore the graph:Temperature Profile C in a new window

Explore the graph:Soil Heat Flux in a new window

Explore the graph:Four-channel radiometer in a new window

Explore the graph:NDVI Channels in a new window

Explore the graph:PAR in a new window

Explore the graph:Air Pressure and Water Level in a new window

Explore the graph:Air T and RH in a new window

3 SW_arable graphs found

Explore the graph:Incoming Solar Bands in a new window

Explore the graph:Reflected Solar Bands in a new window

Explore the graph:Solar Radiation in a new window