Field Notes

<--2021-01-17 09:30:00 | 2021-02-18 08:50:00-->
Other sites visited today: Mayberry | East End | West Pond | Bouldin Alfalfa | Bouldin Corn

Sherman Wetland: 2021-02-04 09:45:00 (DOY 35)
Author: Daphne Szutu
Others: Robert

Summary: Regular data collection/cleaning, windy day, water level still high

2021-02-04
Sherman Wetland

Robert and I arrived at 9:45 PST. It was a clear, sunny day but cold and breezy. There was fresh soil and tractor wheel marks on the levee road. Some new grass is sprouting up already. Patty’s tarp had blown off the refrigerator; we strapped it back on. The staff gauge read 100 cm.

I downloaded met, camera, USB GHG, and miniDOT data. Robert cleaned flux and rad sensors. We changed the miniDOT and water level desiccant. The reservoir was empty; Robert refilled it.

LI-7500 readings:
CO2 417ppm
H2O 243ppm
T 12.3C
P 102.5kPa
SS 106--> 107 after cleaning
LI7700 readings:
CH4 2.0ppm
RSSI 15--> 86 after cleaning

We left around 10:05 PST.

1 photos found

Robert on site
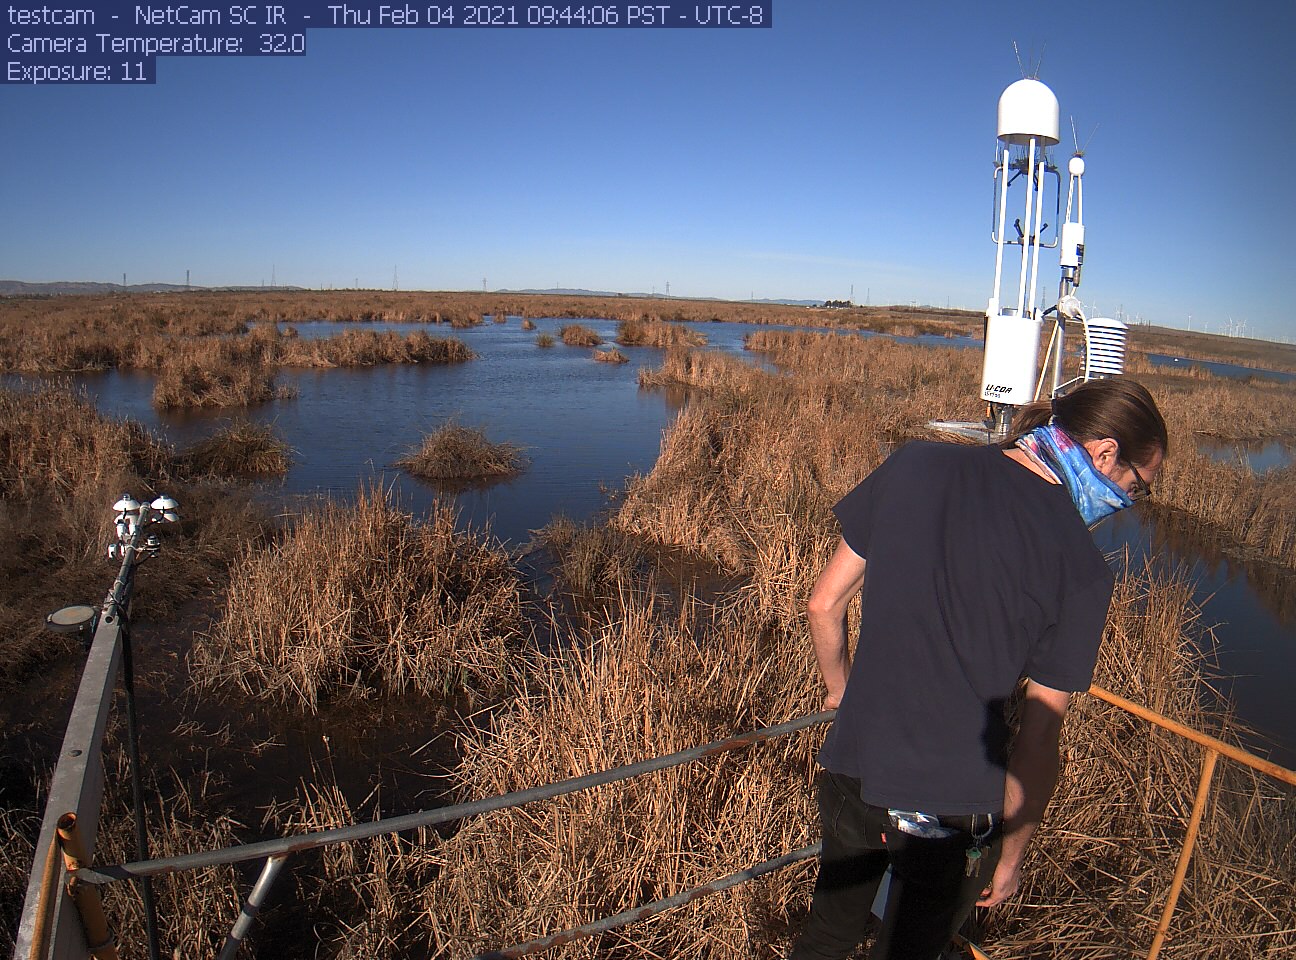
siwetland_2021_02_04_094406.jpg ( 2021-02-04 09:48:04 ) Full size: 1296x960
Robert on site

Graphs display:
7 sets found

Can't check MBWPEESWGT_mixed
Can't check MBEEWPSWEPGT_cam
16 SW_met graphs found

Explore the graph:Temperatures in a new window

Explore the graph:Water Temperature Profile A in a new window

Explore the graph:Water Temperature Profile B in a new window

Explore the graph:Soil Temperature Profile C2 in a new window

Explore the graph:Soil Heat Flux in a new window

Explore the graph:Four channel Radiometer in a new window

Explore the graph:Sherman Wetland PAR in a new window

Explore the graph:PRI Channels in a new window

Explore the graph:NDVI Channels in a new window

Explore the graph:Water level and Rain in a new window

Explore the graph:Dissolved CO2 in a new window

Explore the graph:Air Pressure in a new window

Explore the graph:Battery Voltage and RH in a new window

Explore the graph:Soil Temperature Profile C1 in a new window

Explore the graph:SRS NDVI and PRI in a new window

Explore the graph:SW miniDOT Dissolved Oxygen in a new window

4 SW_flux graphs found

Explore the graph:CO2 and H2O in a new window

Explore the graph:Wind in a new window

Explore the graph:Methane in a new window

Explore the graph:Data Counts in a new window

Can't check MBSWEEWPBCBA
Can't check SW_Temp
14 SW_Temp graphs found

Explore the graph:Temperatures in a new window

Explore the graph:CO2 and H2O in a new window

Explore the graph:Wind in a new window

Explore the graph:Methane in a new window

Explore the graph:Data Counts in a new window

Explore the graph:Temperature Profile A in a new window

Explore the graph:Temperature Profile B in a new window

Explore the graph:Temperature Profile C in a new window

Explore the graph:Soil Heat Flux in a new window

Explore the graph:Four-channel radiometer in a new window

Explore the graph:NDVI Channels in a new window

Explore the graph:PAR in a new window

Explore the graph:Air Pressure and Water Level in a new window

Explore the graph:Air T and RH in a new window

3 SW_arable graphs found

Explore the graph:Incoming Solar Bands in a new window

Explore the graph:Reflected Solar Bands in a new window

Explore the graph:Solar Radiation in a new window