
Field Notes
<--2021-02-18 08:50:00 | 2021-03-04 09:30:00-->Other sites visited today: Hill Slough | Mayberry
Phenocam link: Searching...
Sherman Wetland: 2021-02-26 11:00:00 (DOY 57)
Author: Joe Verfaillie
Others: Daphne, Ariane
Summary: Completely remove the infrastructure still left at the temporary site, install net radiometers on main tower for inter-comparison.
| Sherman Wetland 2021-02-26 Temporary Tower I arrived at 11:00. Daphne and Ariane arrived at 12:00 after visiting Mayberry. It was clear and sunny with a light cool breeze. The cattails are still mostly dead but patches of tule are mostly green. Today we did the final removal of the tower infrastructure – the sensors were removed in mid-November last year. The incoming PAR sensor sn 050597 had been left in place because the bolts were seized. I tried to get them to turn with penetrating oil and vice grips but gave up. I ended up drilling off the heads then was able to get a good grip on the remaining studs and got them removed. The tie down fence post were also hard to remove but I was able to lever them up with the radiation boom. By noon the main tower structure was completely removed. With Daphne and Ariane’s help we got the solar panels, batteries and frame disassembled and everything packed in the truck by about 13:00. We removed solar panels sn 11ZV0M0855, sn 11ZV0M0836 and sn 11ZV0M0829 to take to Hill Slough. We also removed the battery bank sn BB-SW_Temp1 and the solar charge controller sn 11400080. These came back to the lab. The charge controller box was full of wasps, most of them dead. Permanent Tower Daphne, Ariane and I arrived at about 13:00. The staff gauge read 98 cm. It was clear and sunny with a strong cool breeze. The cattails are still brown but there are some green shoots coming up near the tower. The patches of tule are mostly green. This was a quick stop to install net radiometers for inter-comparison. We were also thinking about taking the metal battery box for use at the Hill Slough but decided it was too big of a job for today. We added a CR1000 sn 23865 to the tower to record data from the AMP CNR4 sn 121038 and the Hukseflux NR01 sn 2420 that was broken when the BC tower fell over (both times) and that I repaired in the lab. Both of these radiometers are clamped to the south side of the radiation boom near the end of the square tubing. We left at about 14:00 |
4 photos found
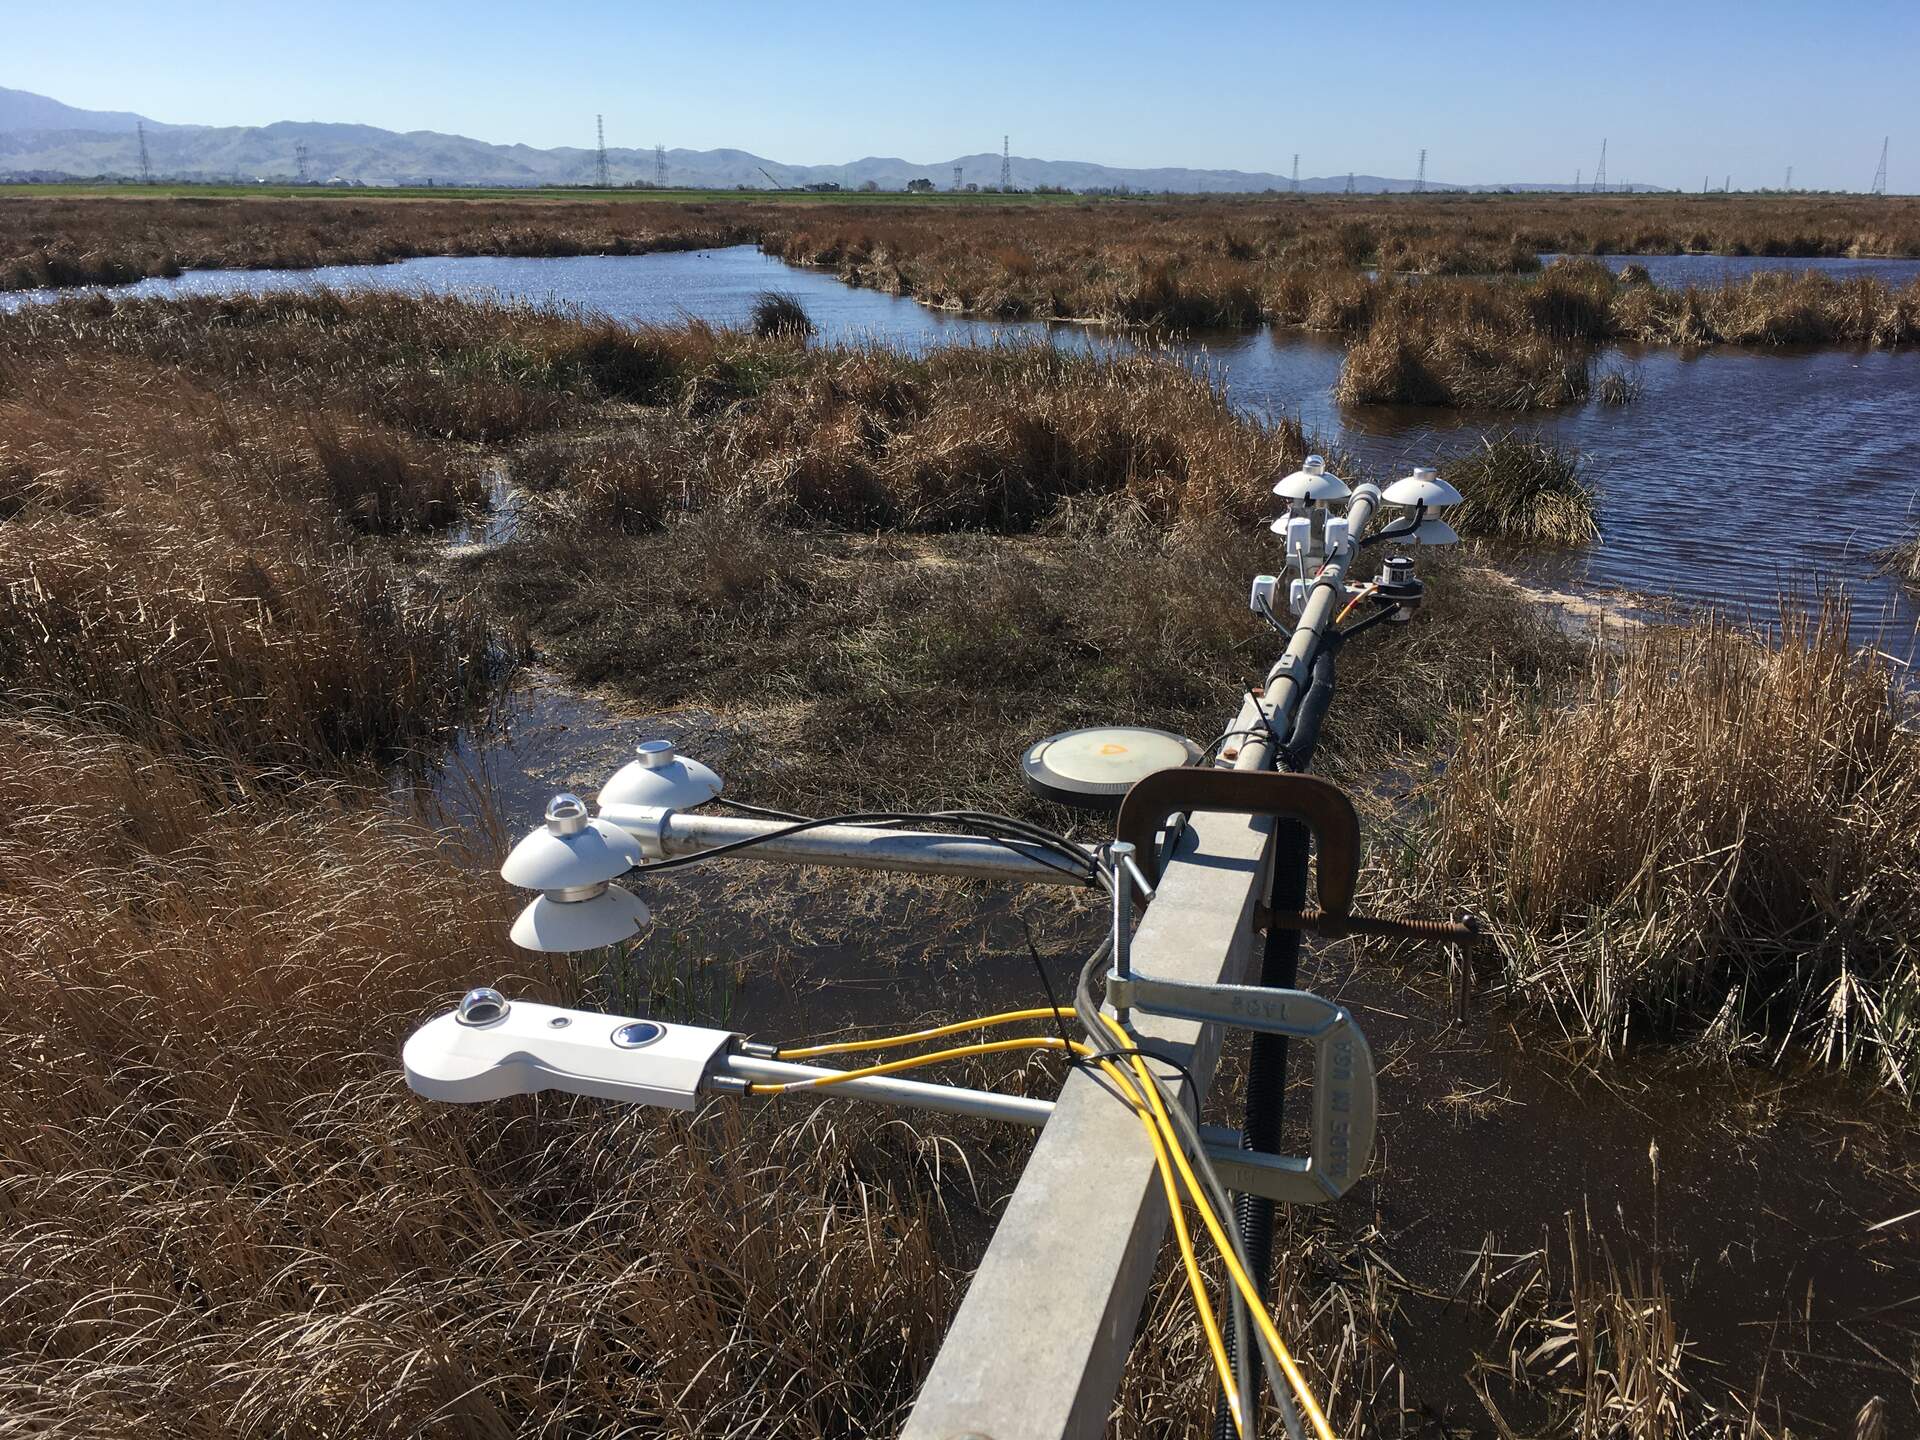
20210226SW_NetRadCompare.jpg ( 2021-02-26 00:00:00 ) Full size: 1920x1440
Beginning of net radiometer comparison: AMP CNR4, SW Hukseflux, repaired BC Hukseflux
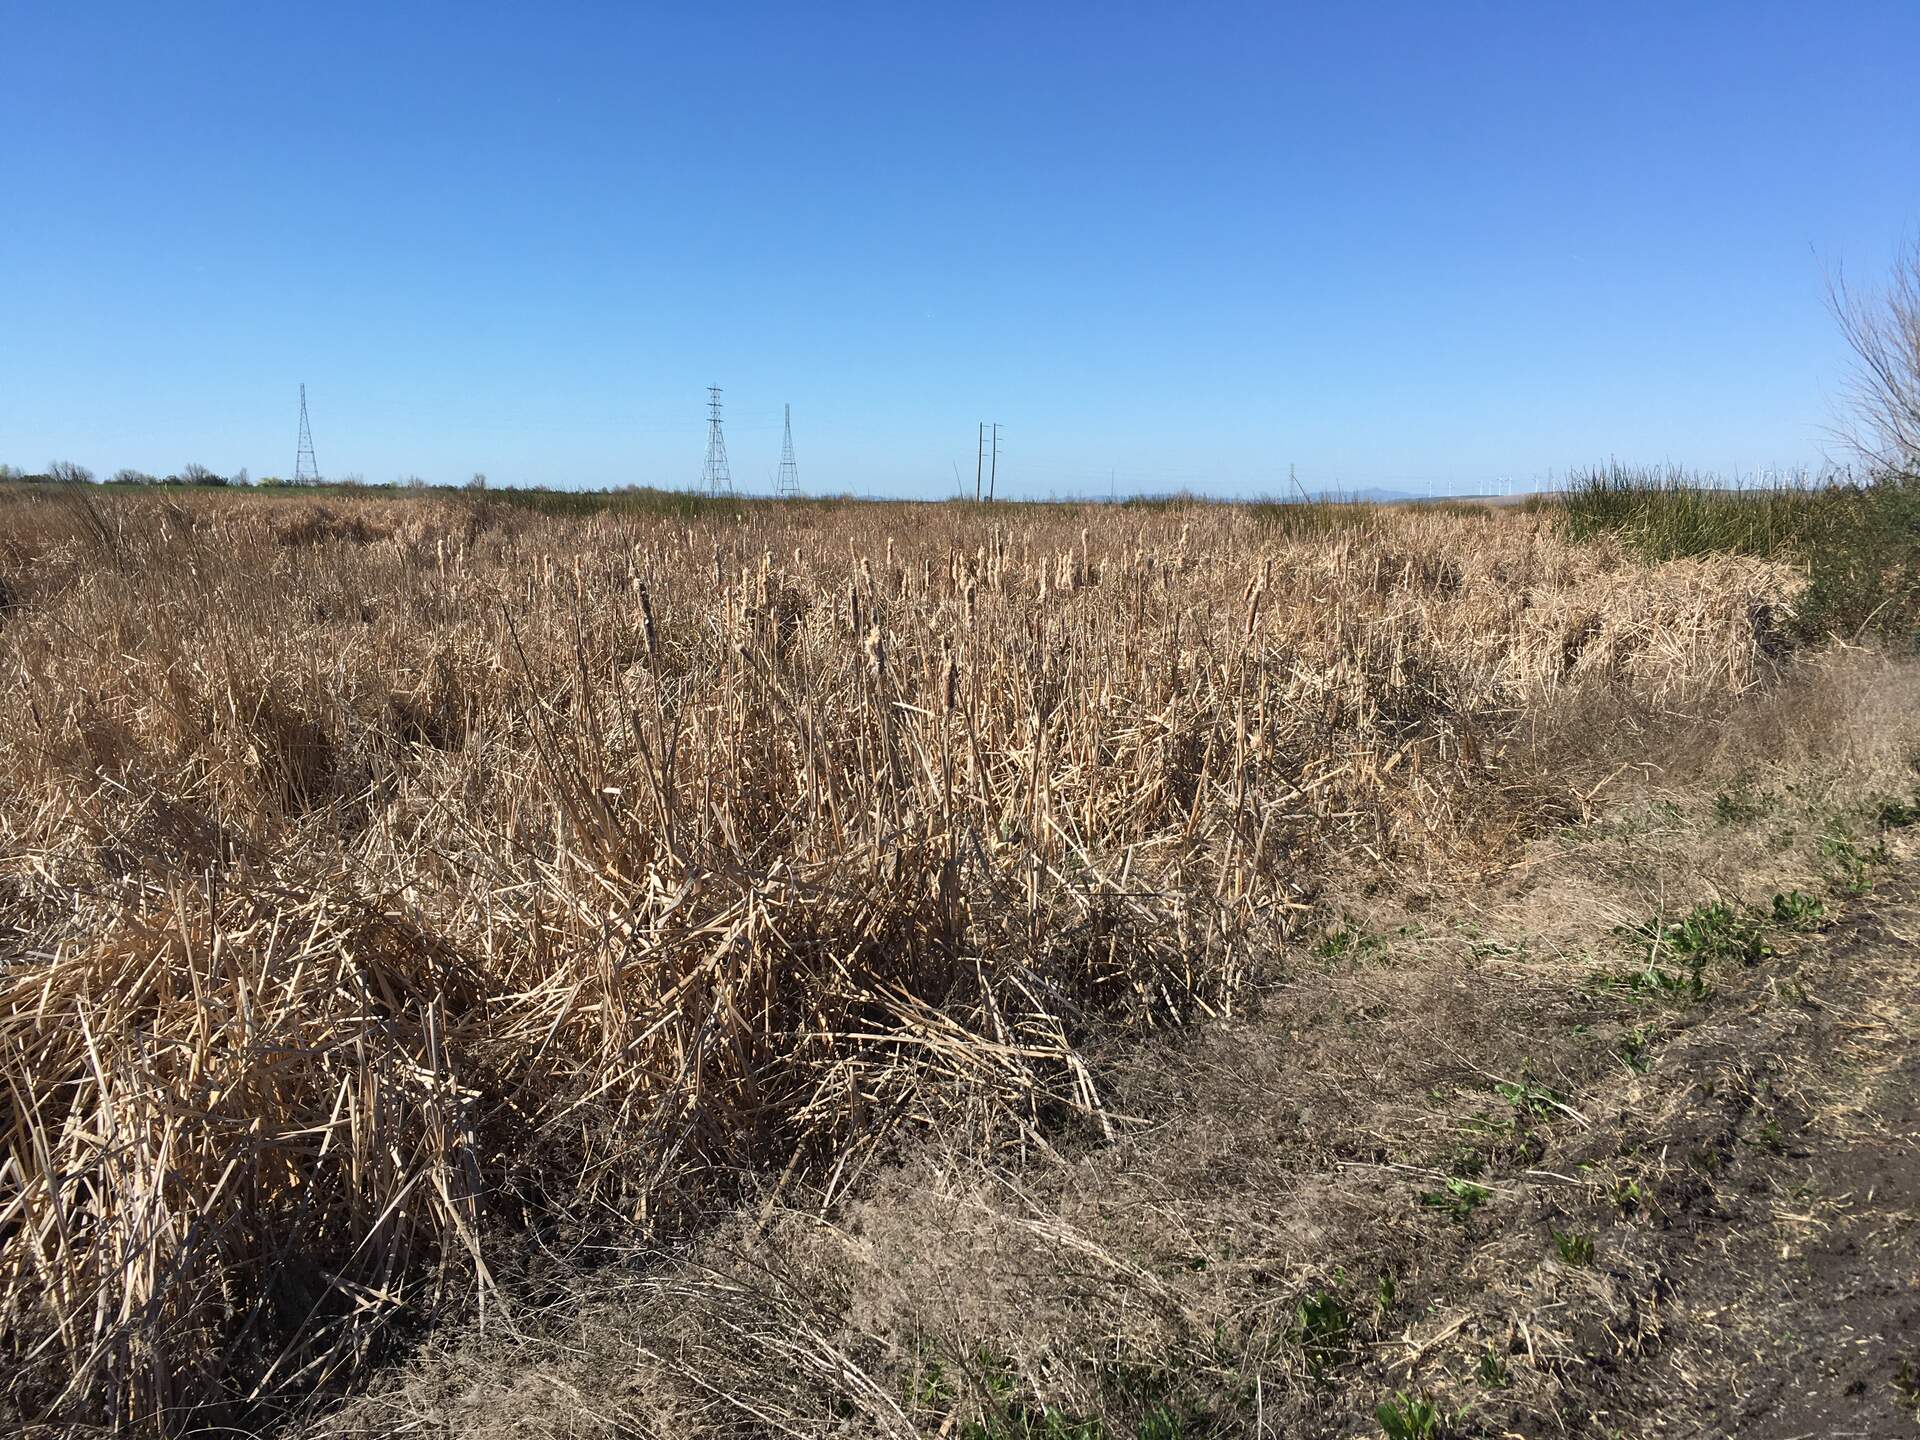
20210226SW_Decommissioned.jpg ( 2021-02-26 12:56:49 ) Full size: 1920x1440
Sherman Temp Tower scaffolding has been completely removed now

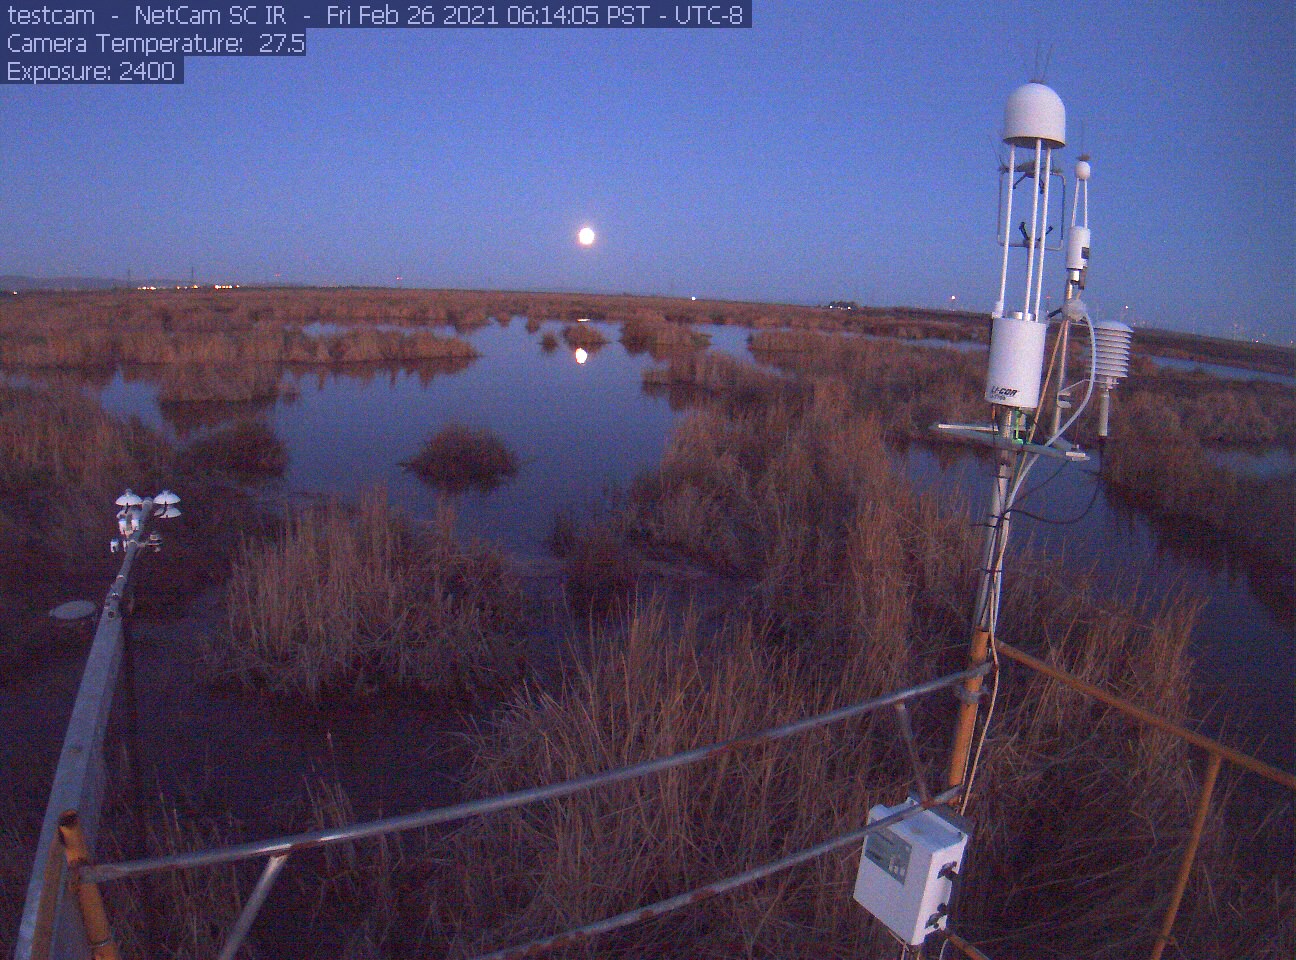
siwetland_2021_02_27_061405.jpg ( 2021-02-27 06:18:54 ) Full size: 1296x960
Full moon at dawn, radiometer intercomparison set up on rad boom
siwetland_2021_02_26_061405.jpg ( 2021-02-26 06:19:00 ) Full size: 1296x960
Almost full moon reflected in water
7 sets found
Can't check MBWPEESWGT_mixed
Can't check MBEEWPSWEPGT_cam
16 SW_met graphs found
4 SW_flux graphs found
Can't check MBSWEEWPBCBA
Can't check SW_Temp
14 SW_Temp graphs found
3 SW_arable graphs found