
Field Notes
<--2021-02-04 14:00:00 | 2021-03-04 15:50:00-->Other sites visited today: Bouldin Corn | East End | West Pond | Mayberry | Sherman Wetland
Phenocam link: Searching...
Bouldin Alfalfa: 2021-02-18 15:50:00 (DOY 49)
Author: Daphne Szutu
Others: Carlos
Summary: Regular data collection/cleaning, alfalfa in field are chewed, missing camera photos, iPad LIDAR scans of tower
| 2021-02-18 Bouldin Alfalfa Carlos and I arrived at 15:50 PST. It was calm and mild with streaky clouds. There were sheep on the side of the levee and on the alfalfa field next to it, 2 fields to our east. The dirt road and the field were fine to drive on, besides that one big puddle in the dirt road at the turn. The alfalfa was about 5-10cm tall in the field and looked freshly chewed, with only a clump of stem and chewed leaves left for each plant. Around and under the tower, the alfalfa was about 20-30cm tall with full lush leaves, but there was no distinct line between the chewed and unchewed areas as we usually see after sheep have grazed the field. Maybe the birds have been at it again. Unfortunately, there were only a few days of phenocam photos since the most recent site visit, so I’m not sure about the birds. I downloaded met, camera, and USB GHG. I forgot to bring a replacement CF card so I moved the camera card files onto the laptop and then reinserted the blank card. This card is probably old and needs to be replaced, because it only had 3 days of photos. I downloaded the FD data and cleared its memory. Carlos cleaned flux and rad sensors. He reported the PARin sensors was dirty. The wash reservoir was mostly full; I topped it off. I left a prophylactic mothball in the met datalogger box. Carlos used his iPad to take some LIDAR shots of the tower. LI-7500 readings: CO2 423ppm H2O 241ppm T 16.4C P 102.6kPa SS 99--> 99 after cleaning LI7700 readings: CH4 2.5 ppm RSSI 50-->72 after cleaning We left at 16:15. |
Next Mowing: 2021-02-20
3 photos found

20210218BA_IpadLidar.jpg ( 2021-02-18 00:00:00 ) Full size: 1833x1113
Ipad LIDAR scan of Bouldin Alfalfa tower
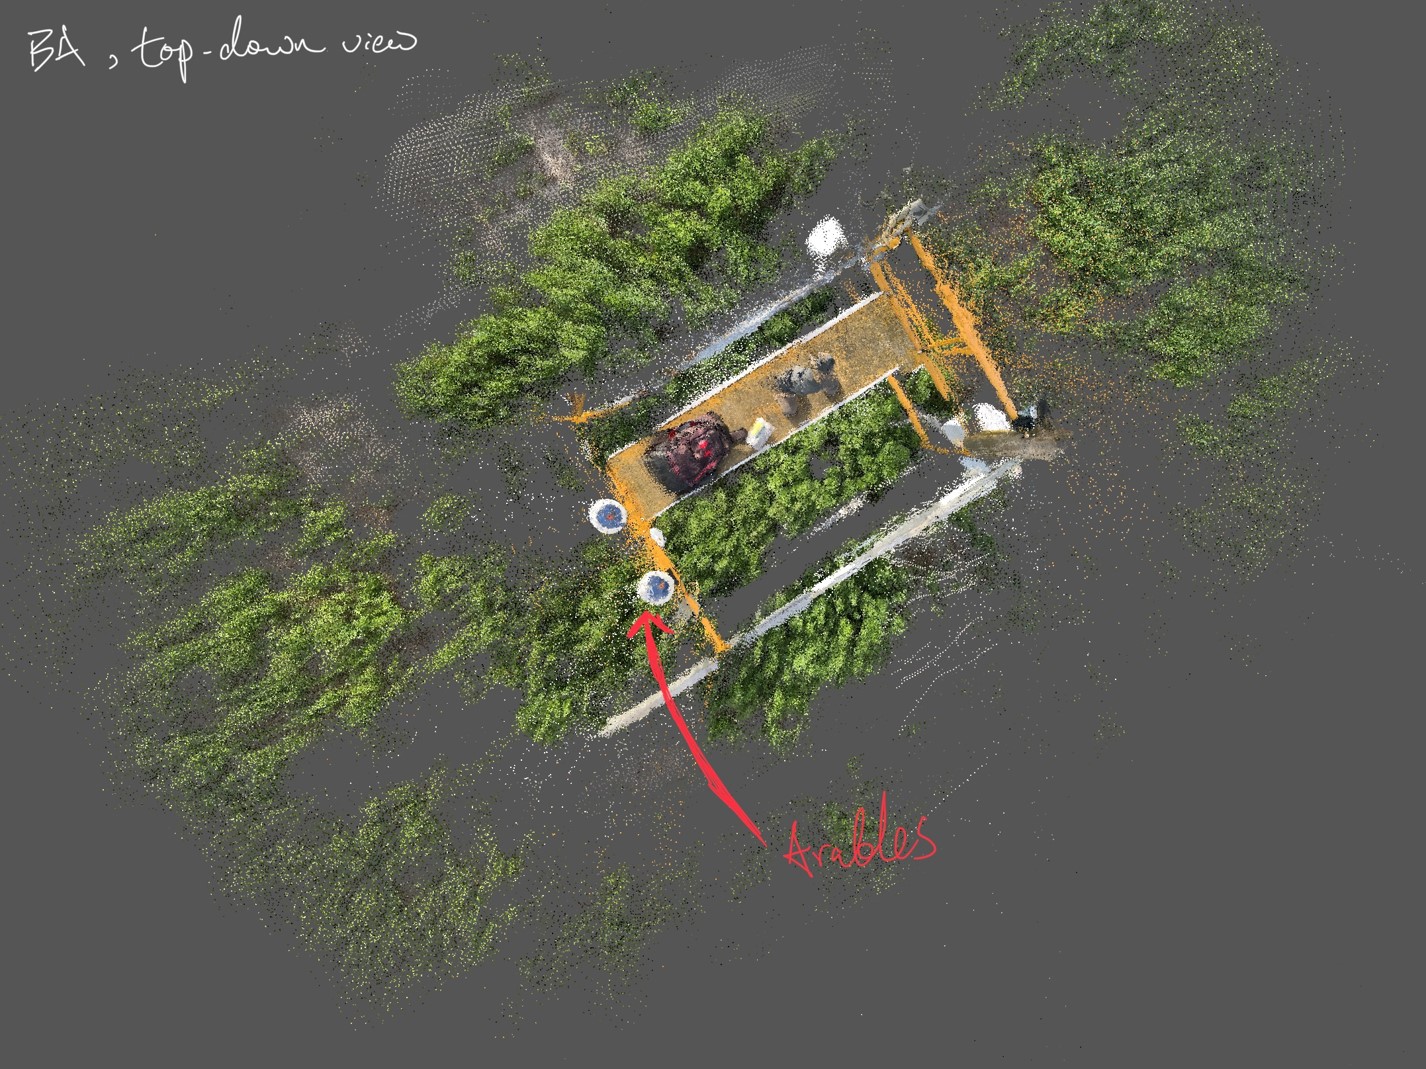
20210218BA_IpadLidar2.jpg ( 2021-02-18 00:00:00 ) Full size: 1426x1069
Ipad LIDAR scan of Bouldin Alfalfa tower from birds-eye view

20210218BA_UngrazedPatches.jpg ( 2021-02-18 16:09:40 ) Full size: 1920x1440
Ungrazed patches of alfalfa underneath PL Arables and our tower. The patches don't have clear boundaries, so it might have been birds instead of sheep.
7 sets found
5 BA_flux graphs found
21 BA_met graphs found
6 BA_arable graphs found
Can't check TATWBABCSB_cam
Can't check MBSWEEWPBCBA
2 BA_processed graphs found
No data found for BA_adex.