
Field Notes
<--2020-11-03 08:15:00 | 2020-12-03 08:40:00-->Other sites visited today: Bouldin Alfalfa | West Pond | East End | Mayberry
Phenocam link: Searching...
Bouldin Corn: 2020-11-19 08:40:00 (DOY 324)
Author: Joe Verfaillie
Others: Daphne
Summary: Heavy fog, calibrated 7700, installed experimental Eosense sensors, tested tipping bucket
| Bouldin Corn 2020-11-19 Daphne and I arrived at 8:40. It was cold and foggy – so foggy that I nearly missed the exit from the highway. We could hear but not see lots of geese around. Nearby fields were not flooded but fields north of the highway were. Rain last Tuesday has left the ground wet. When we arrived the open-paths were wet. The 7500 read: 522ppm CO2, 37mmol/m3 H2O, 7.1C, 102.0kPa, 78SS After cleaning: 477ppm CO2, 450mmol/m3 H2O, 8.1C, 102.0kPa, 102SS The 7700 read 2.4ppm CH4, 0RSSI – 2.2ppm CH4, 50RSSI after cleaning We topped off the wash reservoir. There was too much fog to get the 7700 RSSI very high. When we put the hood on and started to run dry air the RSSI rose to 88. We calibrated the 7700 – it was almost right on. We calibrated the tipping bucket sn 65548-615 pouring only half the water in at a time so that there isn’t such a pressure head change from start to finish and this slows the drip rate. We got 116 tips. Last week we were getting around 90 tips with faster drip rates. Hard to say if the buckets are that far off or if the drip rates make that much difference – neither are good news. We did not adjust the bucket. I set up the new experimental Eosense distributed forced diffusion soil co2 sensors (NFD). Right now they are under the scaffolding around the existing FD chamber. Hopefully we can move them into the field in the next couple weeks. I picked up the junction box off the ground and cable tied it to the scaffolding. I removed the two cables for the other FD chambers and added the four cables for the new sensors. The screws for the box lid are lost so I just strapped it on with cable ties. One side of the net radiometer is loose. It needs to be partially disassembled to fix. We also need to think about moving the tower back closer to the field proper and getting the soil sensors in the field. Maybe plan to have a work day here in the next couple weeks. We left at 9:55 |
2 photos found
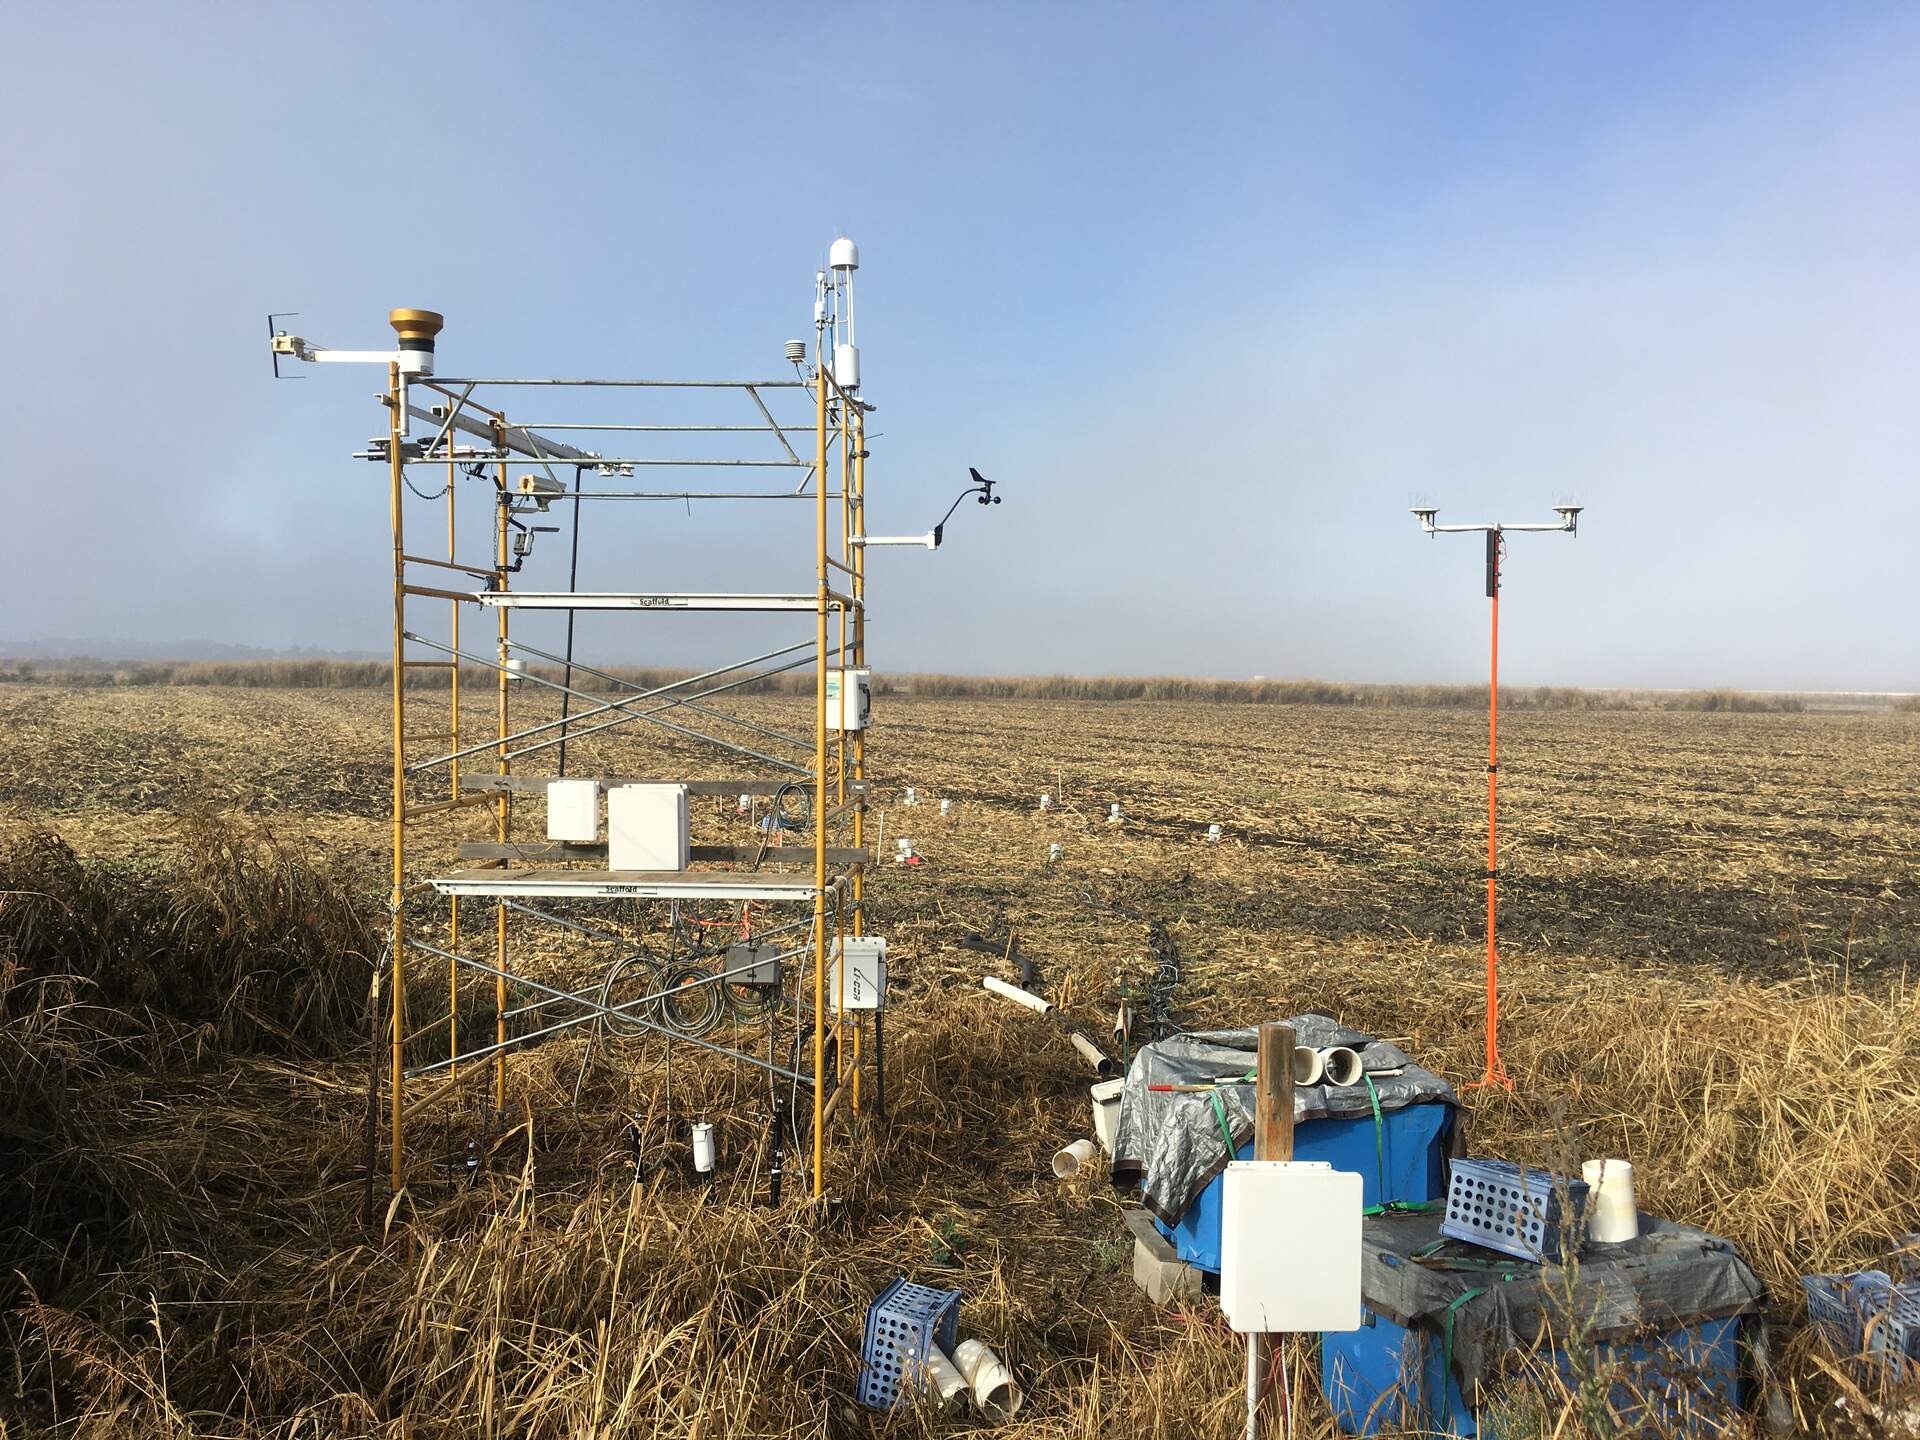
20201119BC_Site.jpg ( 2020-11-19 09:55:00 ) Full size: 1920x1440
View of the site and morning fog
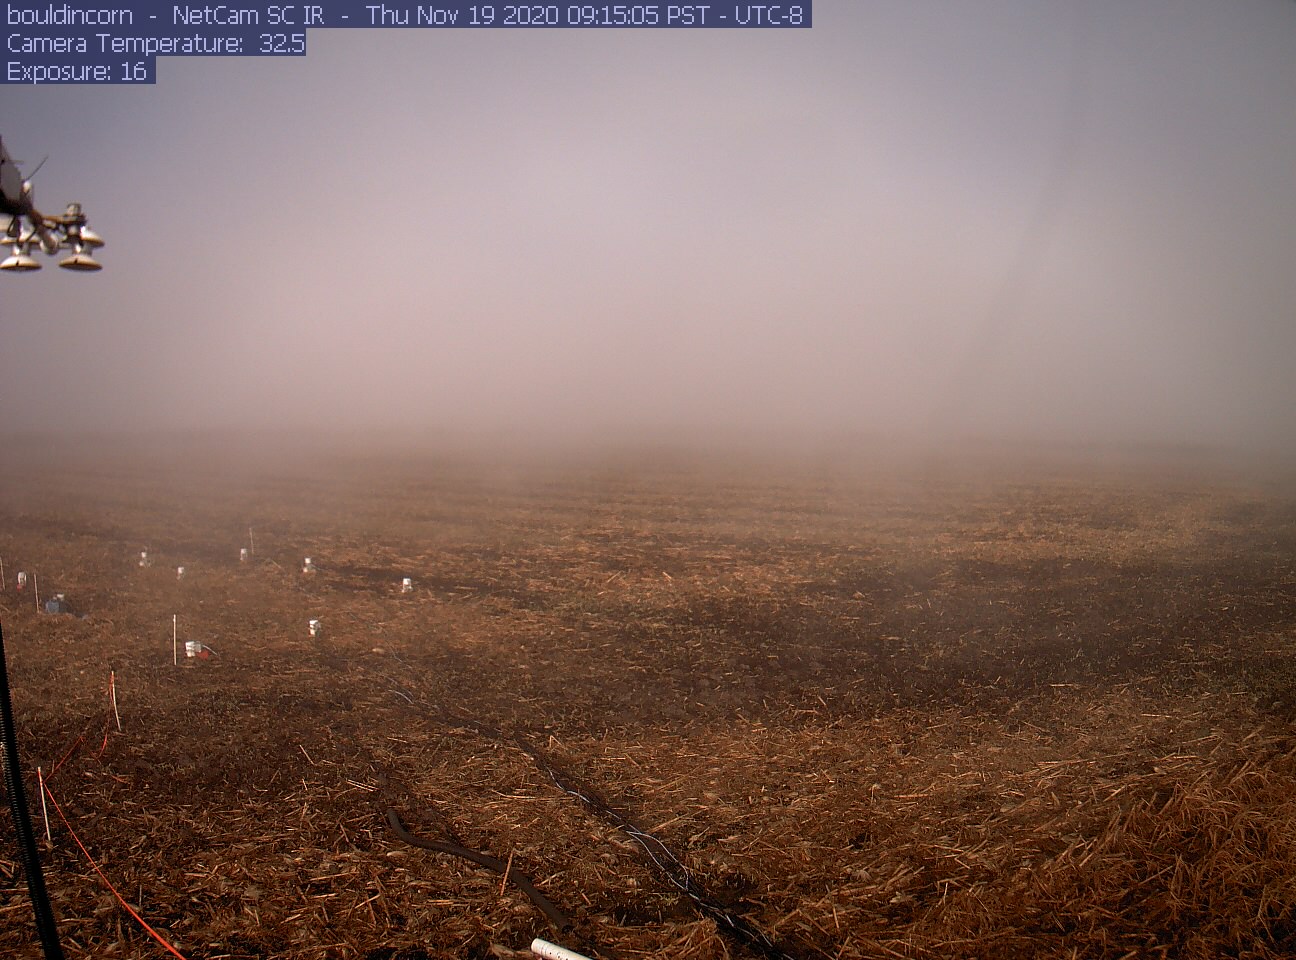
bouldincorn_2020_11_19_091505.jpg ( 2020-11-19 09:16:12 ) Full size: 1296x960
Foggy morning during the site visit. It was hard to see the highway exit.
6 sets found
17 BC_met graphs found
5 BC_flux graphs found
Can't check TATWBABCSB_cam
Can't check MBSWEEWPBCBA
2 BC_pa graphs found
1 BC_arable graphs found