
Field Notes
<--2020-10-22 15:30:00 | 2020-11-12 11:20:00-->Other sites visited today: Bouldin Alfalfa | Bouldin Corn | East End | West Pond | Mayberry
Phenocam link: Searching...
Sherman Wetland: 2020-11-03 12:10:00 (DOY 308)
Author: Daphne Szutu
Others: Ariane
Summary: Permanent: Regular data collection/cleaning, water level has come up, removed conductivity sensor to bring to MB, soil samples for Kuno Temporary: Regular data collection/cleaning, many dead wasps in met box
| 2020-11-03 Sherman Wetland Ariane and I arrived at 12:10 PST. It was a sunny and mild day with a little breeze, clear skies and haze at the horizons. There is finally more water at this wetland! It was still dry under the tower, but the staff gauge read 58cm. Most of the reeds are yellowing. Patty’s tarp had blown off the refrigerator so we strapped it back on. Ari took soil samples for Kuno for mineralogical analyses. Ten soil samples were taken every one meter approx. on a transect across the footprint starting at the tower. The samples consisted of 15 cm soil cores and covered dry soils near the tower (n = 5) and saturated soils from the water patch in front of the tower (n = 5). I downloaded met, camera, USB GHG, miniDOT, and globe TC data. I swapped desiccant for the water level sensor and miniDOT. I cleaned flux and rad sensors and gently removed spiderwebs and cattail fluff from the globe thermometers. I straightened one of the globes that had been bent downward. The wash reservoir was ½ full; I refilled it. The wash reservoir tubing was degrading where it connected to the wash box, so I snipped off the degraded part and reattached it with a small zip tie. I cleaned out the precip bucket tipper and tipped it a few times. I removed the conductivity sensor sn 7157 to install at MB for an intercomparison with the conductivity sensor there. Wiring at A547 conductivity interface: A547 port – wire color – datalogger port AG – green – shield SE T - orange – SE 6 EX T – blue – VX3 EX Cond – white – VX1 H Cond – red – 4H L Cond – blue – 4L A547 port – wire color to sensor: Shield – green wire to sensor (was broken) Shield – clear T – red Cond – orange Ex Cond – black Ex Temp – green LI-7500 readings: CO2 414ppm H2O 503ppm T 22.7C P 101.8kPa SS 98--> 103 after cleaning LI7700 readings: CH4 1.9 ppm RSSI 30--> 82 after cleaning We left at 13:10 PST. 2020-11-03 Sherman Wetland Temporary Tower Ariane and I arrived at 13:25 PST. It was a sunny and mild day with a little breeze, clear skies and haze at the horizons. Last visit I had put some mothballs into the met box, and this time the met box was a wasp cemetery. I swept out dozens of dead or almost-dead wasps. The water level is about the same, but still below the staff gauge. I downloaded met, camera, and USB GHG data. I swapped desiccant for the water level sensor. Ari cleaned flux and rad sensors. The lower 7700 mirror was pretty dusty with some small sticky blobs. The wash reservoir was ½ full; we refilled it. LI-7500 readings: CO2 420pm H2O 550ppm T 24.9C P 101.9kPa SS 94--> 98 after cleaning LI7700 readings: CH4 1.7ppm-->1.9 after cleaning RSSI 6--> 70 after cleaning We left at 13:45 PST. |
1 photos found
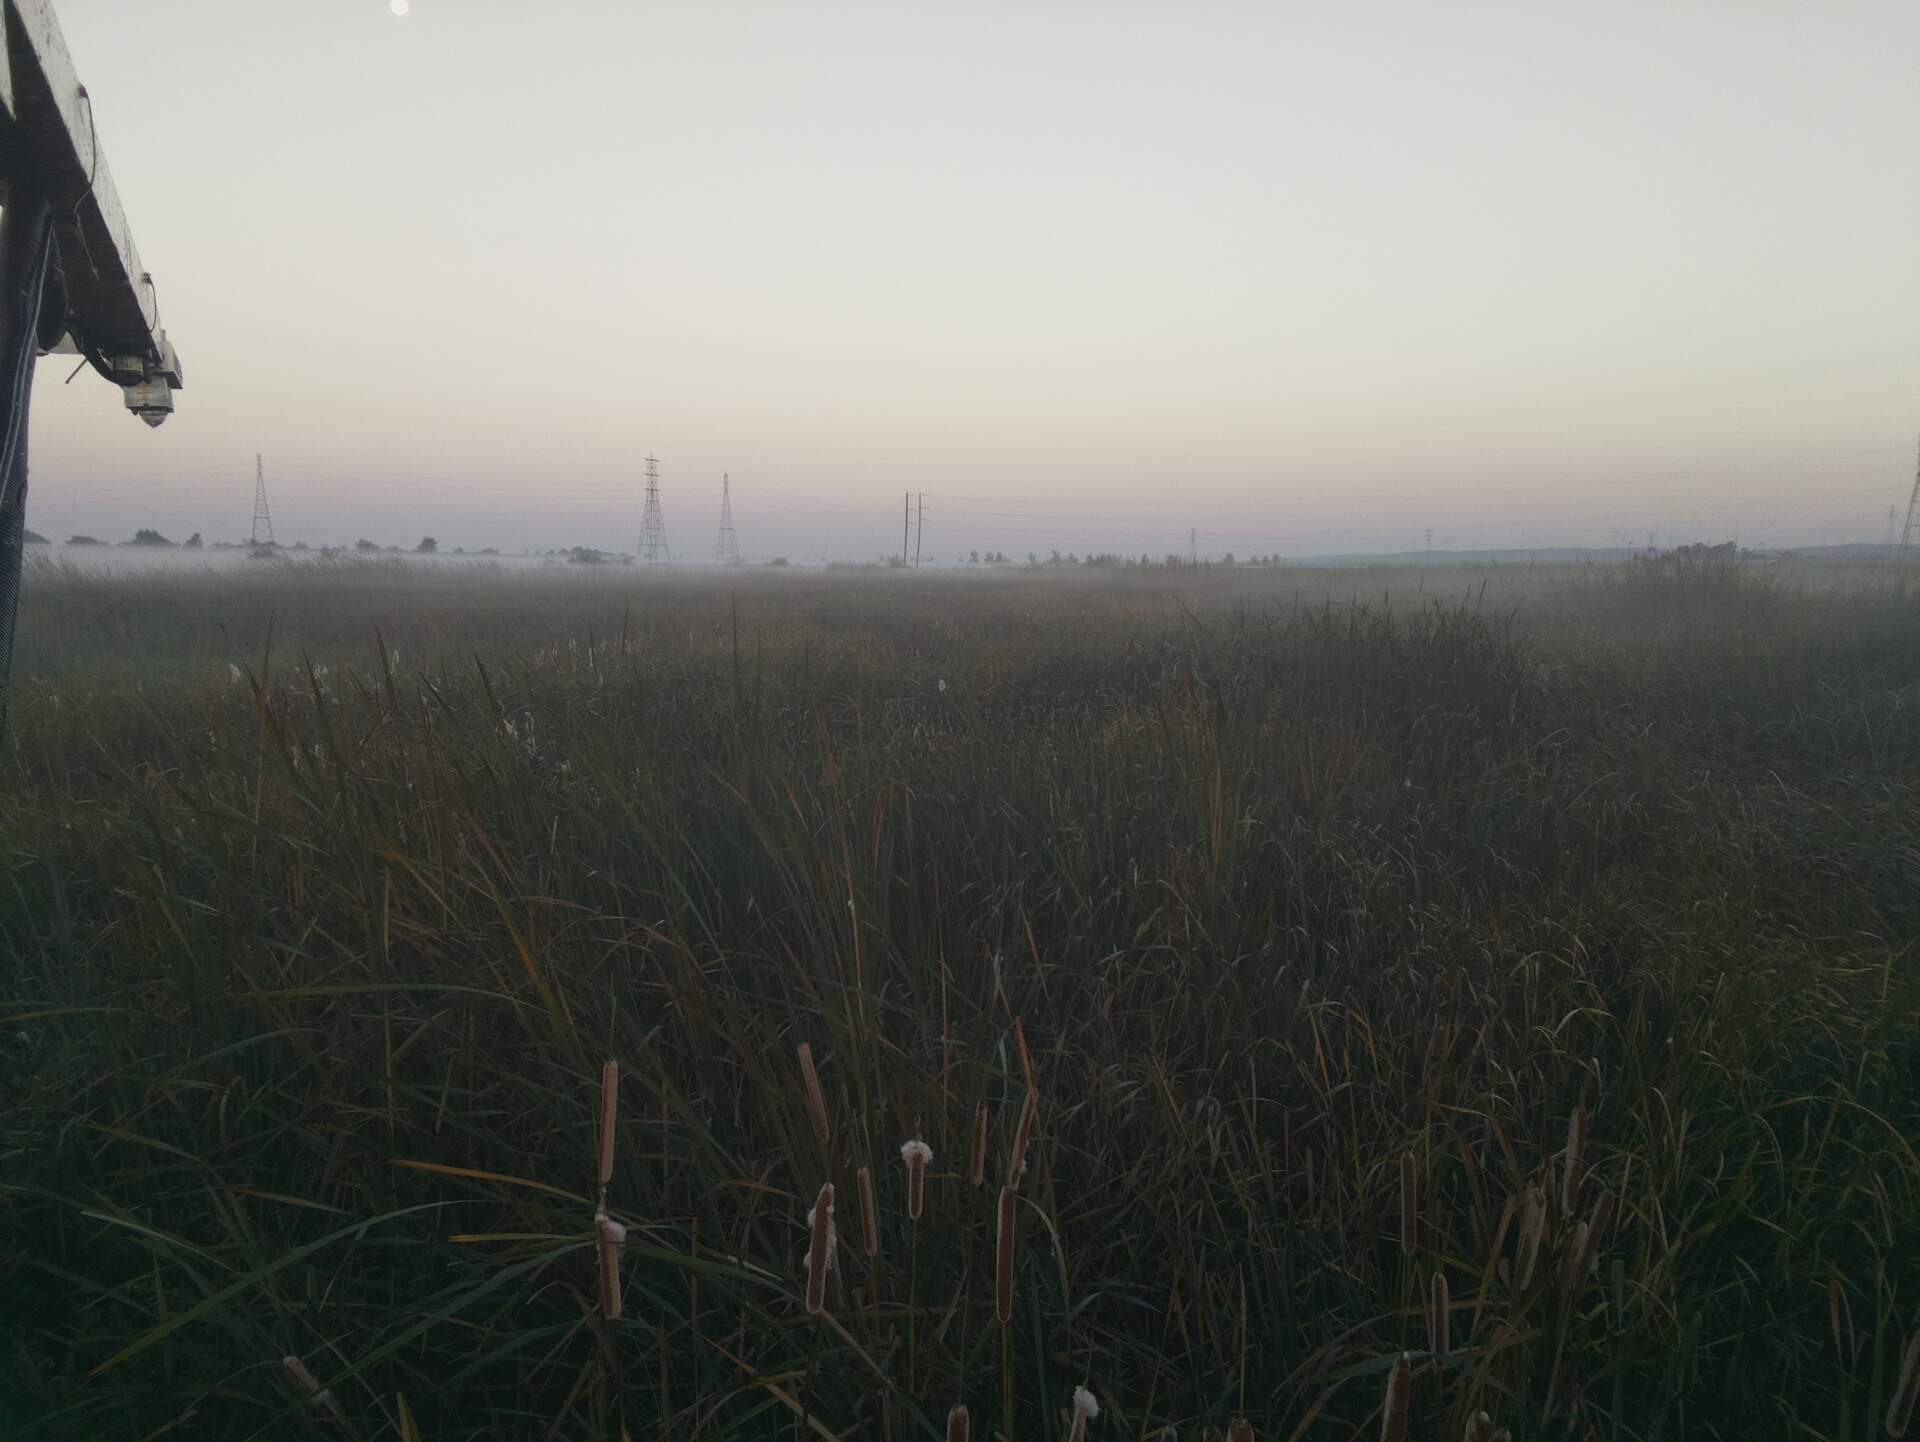
SW_T1_picam_20201102_0645.jpg ( 2020-11-02 06:45:05 ) Full size: 1920x1442
Early morning tule fog
7 sets found
Can't check MBWPEESWGT_mixed
Can't check MBEEWPSWEPGT_cam
16 SW_met graphs found
4 SW_flux graphs found
Can't check MBSWEEWPBCBA
Can't check SW_Temp
14 SW_Temp graphs found
3 SW_arable graphs found