
Field Notes
<--2020-11-03 12:10:00 | 2020-12-03 14:30:00-->Other sites visited today: Mayberry | Hill Slough
Phenocam link: Searching...
Sherman Wetland: 2020-11-12 11:20:00 (DOY 317)
Author: Daphne Szutu
Others: Joe
Summary: Permanent: Regular data download/cleaning, calibrated 7700, attempted to calibrate tipping bucket, removed HMP155/GlobeTC Temporary: Decommissioned site, measured instrument heights
| 2020-11-12 Sherman Wetland Joe and I arrived at 11:20 PST. It was a mild, still, and sunny day with hazy horizons. The water level has come up and there is even water under the tower now. The staff gauge read 71cm. I downloaded met, camera, and USB GHG. Joe cleaned flux and rad sensors. We left some mothballs in the met box and the CR10x box. We tested the tipping bucket sn 65552-615. I cleaned out the tippers and then dripped 475ml of water through the bucket which should result in 100tips. We got 92 tips. We turned its set screw two full rotations CW. We tested it again with another 475ml of water and got 96 tips. We left it as is. Joe thought the bottle was dripping water too quickly, so the bucket was undercounting. We’ll test again with a smaller hole at the bottom of the bottle. We calibrated LI-7700 sn TG1-0424. The zero and span offsets were small. The 7700 wash/spin settings looked fine. The optics RH was 12%, so we did not change the drierite or flush the head space. We removed the GlobeTC, HMP155 (sn R0360206), and CR1000 sn 4190 and brought them back to the lab. We’ll add an AMP PAR sensor and move it to WP for a comparison. LI-7500 readings: CO2 427ppm H2O 420ppm T 13.7C P 101.9kPa SS 101--> 103 after cleaning LI7700 readings: CH4 2.2 ppm --> 2.2 after calibration RSSI 57--> 80 after cleaning We left at 12:25 PST. 2020-11-12 Sherman Wetland Temporary Tower Joe and I arrived at 12:40 PST. It was a mild, still, and sunny day with hazy horizons. There was lots of cattail fluff in the air. There were mushroom-shaped smoke clouds to our north. We removed all the sensors except for PARin, which was stuck to the rad boom. We brought all the sensors and cables back in. Still at the tower are the well pipe, grounding rod, and grounding cable. The solar panels, batteries, and solar charge controller remain at the site. We measured some instrument heights: 7500 height = 476cm Sonic height = 476cm Sonic heading = 14 deg N true 7700 heights = 432cm HMP height = 432cm 4-way rad height = 361cm 4-way rad length along boom = 250cm west PARin height = 370cm PARin length along boom = 211cm west PARout height = 356cm PARout length along boom = 217cm west Picam height = 337cm Top of pipe to water level = 70cm Top of pipe to ground = 74cm Top of pipe to sensor = 147cm Equipment removed: WM 1590: sn 153803 LI-7700: sn TG1-0211 LI-7500A: sn 75H-2180 LI-7550: sn AIU-0650 PTB110: sn H0160093 CR1000: sn 50889 AM16/32A: sn 1164 AM25T: sn 2856 HFP 1: sn 00245 HFP 2: sn 10809 eosGP: sn GP20150111 SRS-Ni NDVI: sn 2046503368 SRS-Ni NDVI: sn 2046503402 CNR1: sn 990181 PAR-LITE out: sn 050596 PAR-LITE in: sn 050597 (not removed; couldn't remove from boom) HMP60: sn G4540021 Water Level CS450: sn 20010770 Pi-cam: sn RPI0W-004 We left at 14:30 PST. I downloaded the met, flux, and cam data back in the lab. |
2 photos found
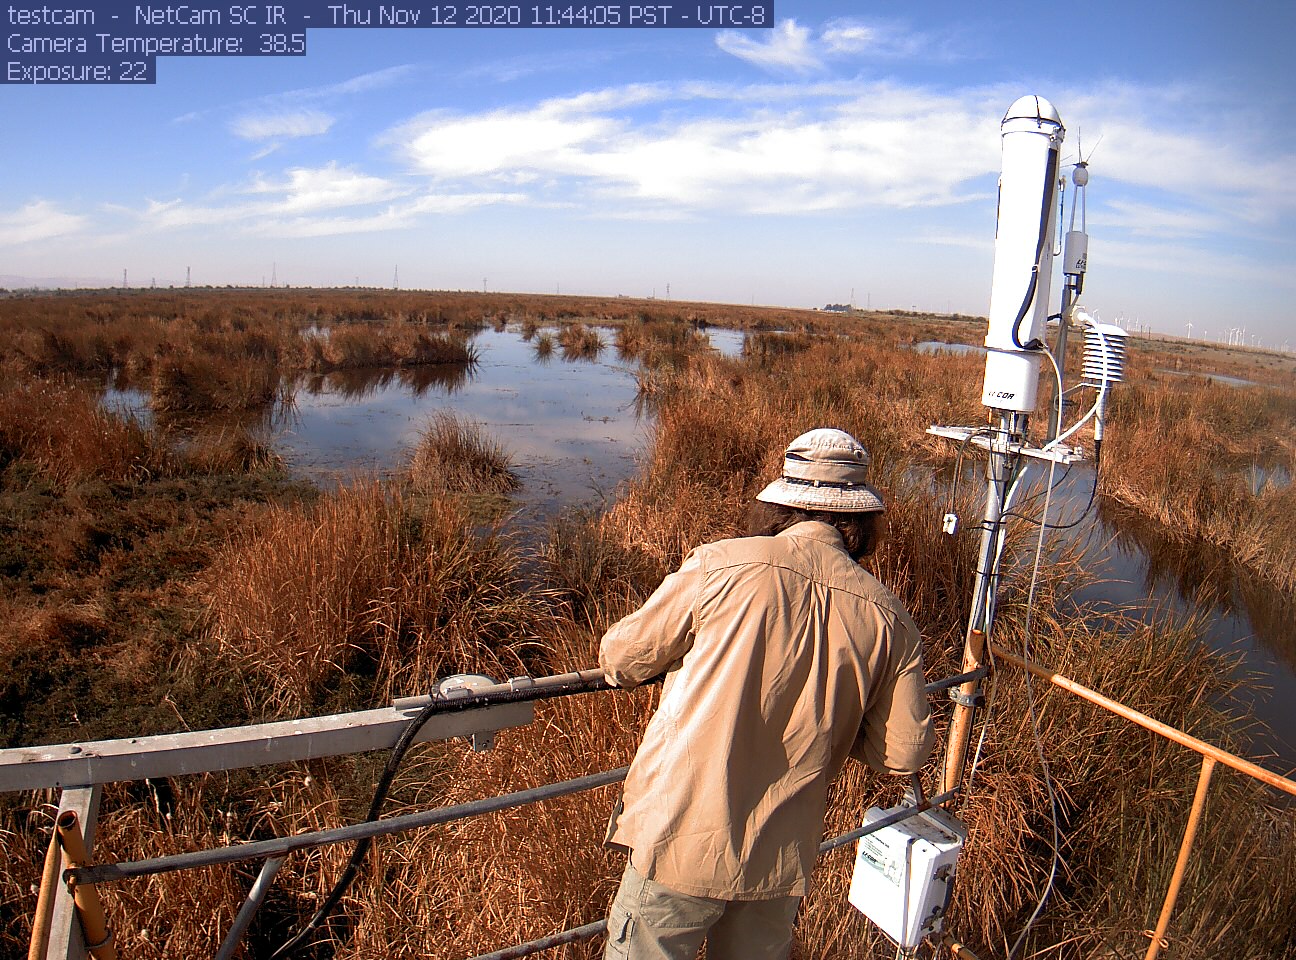
siwetland_2020_11_12_114405.jpg ( 2020-11-12 11:46:14 ) Full size: 1296x960
Joe cleaning radiometers
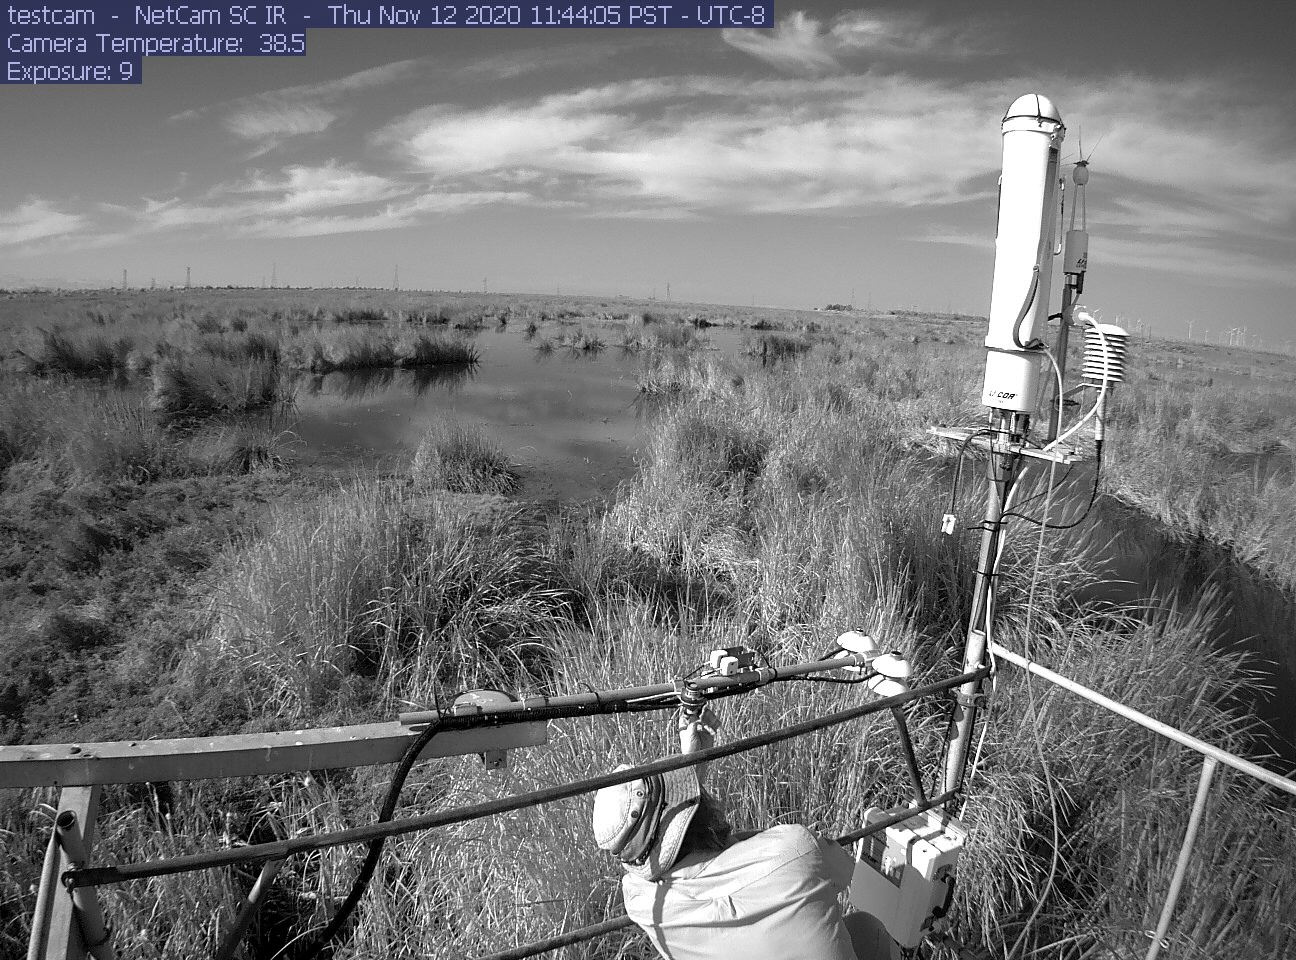
siwetland_IR_2020_11_12_114405.jpg ( 2020-11-12 11:47:02 ) Full size: 1296x960
Joe cleaning radiometers
7 sets found
Can't check MBWPEESWGT_mixed
Can't check MBEEWPSWEPGT_cam
16 SW_met graphs found
4 SW_flux graphs found
Can't check MBSWEEWPBCBA
Can't check SW_Temp
14 SW_Temp graphs found
3 SW_arable graphs found