
Field Notes
<--2002-11-06 15:25:00 | 2002-12-06 14:57:00-->Phenocam link: Searching...
Tonzi/Vaira: 2002-11-14 13:30:00 (DOY 318)
Author: LiuKang Xu
Others: Jianwu
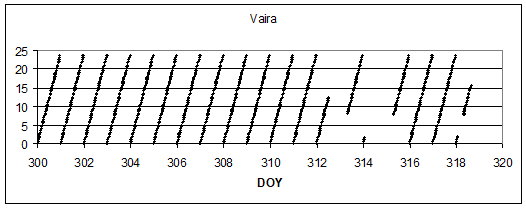
Summary: Soil respiration measurements, tower hmp fan dead, problems with Vaira key board, losing power at Vaira?
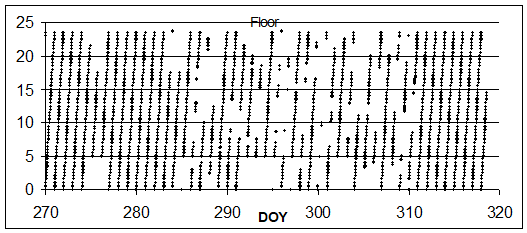
When: Nov 14, 2002 D318 Thursday. Trip Purpose: check 3 flux systems and download data, soil moisture probe reading, dendrometer reading, Jianwu did soil respiration measurements Problem: The keyboard of laptop at Vaira seems to have some problems, I can not turn off the gillsonic.exe by punching alt+x, Ctrl+Alt+Del also didn’t work , I have to turn off the pc manually. Overall: Floor flux system back to normal operation since Ted’s last visit on 11/6 (d310).
Tower system running good. The fan for T/RH at the top of tower was broken, need to replace it. Vaira site, we started to miss some data (see the watchdog below), need talk to Ted. It is due to the solar power or something else?
About 1/3 of oak leaves still hang on the trees after the last storm. Grass at both sites already started to germinate. Tonzi Ranch: arrived at 1:30 pm. Clear sky, little windy temperature mid 60s. Soil moisture reading:
All data were averaged from three readings Dendrometer reading: The oak trees expanded lot since the last storm.
Floor system: flux system and fence working well. PVC reading 13.2, 2.9 and 2.4 at 2:30 pm. Battery fully charged. HD 0.97 GB left. After reboot laptop, flux program running properly.
Note the high values of CO2 channel due to the recent rain and warm weather. Tower system: fence OK. PV reading 13.4, 13.0 and 2.11 at 15:20. battery fully charged. HD has 2.4 GB left. After downloaded data, reboot PC, w, u, v, Tsonic, q and CO2 outputs on scale.
Jianwu’s Notes Soil CO2 profile measurements work well after a rain. The highest concentration reaches 5000ppm. I add three gortex sacs for them and hope they can survive the coming rains. Soil respiration measurements read about 2 micro mol/m2/sec. The stem respiration has the similar reading. In order to quantify the relationship of soil respiration between trees and non-trees, I installed more soil collars (6 collars) on ground, each with 1m apart. It seems soil respiration gradually decreases with the distance from the tree. Vaira ranch: arrived around 4:00 pm, flux system and fence running well. PVC reading 12.9, 2.4and 2.4 at 4:30. 1.32 GB left on HD. All communication with data loggers is good. Download data and soil moisture reading.
|
0 photos found
16 sets found
No data found for TZ_Fenergy.
11 TZ_tmet graphs found
No data found for TZ_soilco2.
Can't check TZ_mixed
3 TZ_mixed graphs found
No data found for TZ_fflux.
8 TZ_fmet graphs found
No data found for TZ_tram.
No data found for TZ_co2prof.
No data found for TZ_irt.
No data found for TZ_windprof.
No data found for TZ_tflux.
2 TZ_sm graphs found
Can't check TZ_met
1 TZ_met graphs found
Can't check TZVR_mixed
No data found for TZ_osu.
No data found for TZ_fd.