
Field Notes
<--2020-05-21 09:00:00 | 2020-06-02 14:30:00-->Other sites visited today: West Pond | East End | Bouldin Corn | Bouldin Alfalfa | Mayberry
Phenocam link: Searching...
Sherman Barn: 2020-05-29 08:30:00 (DOY 150)
Author: Joe Verfaillie
Others:
Summary: Quick GHG data collection after firmware upgrade, piles of peat from ditch clearing for wetland construction
| Sherman Barn 2020-05-29 I arrived at 8:30. It was cool with high thin clouds and a really strong gusty wind from the west. Wetland construction continues mostly to the west. They have dug out the ditch just east of our site piling up giant block of peat along the side of the ditch to the west north of our site and to the east south of our site. The gate was open and a couple trucks drove past upwind of our tower while I was there. I collected the Licor GHG data after the upgrade of the firmware last week. Looks like the summary files are no longer being created and I didn’t see any settings to change this. However this is not particularly important since we don’t use those files anyway. After I process the 20Hz I should know if something has changed there. I cleaned the 7700 mirrors since they were a little dirty but I didn’t write down the numbers. I left at about 8:45 |
1 photos found
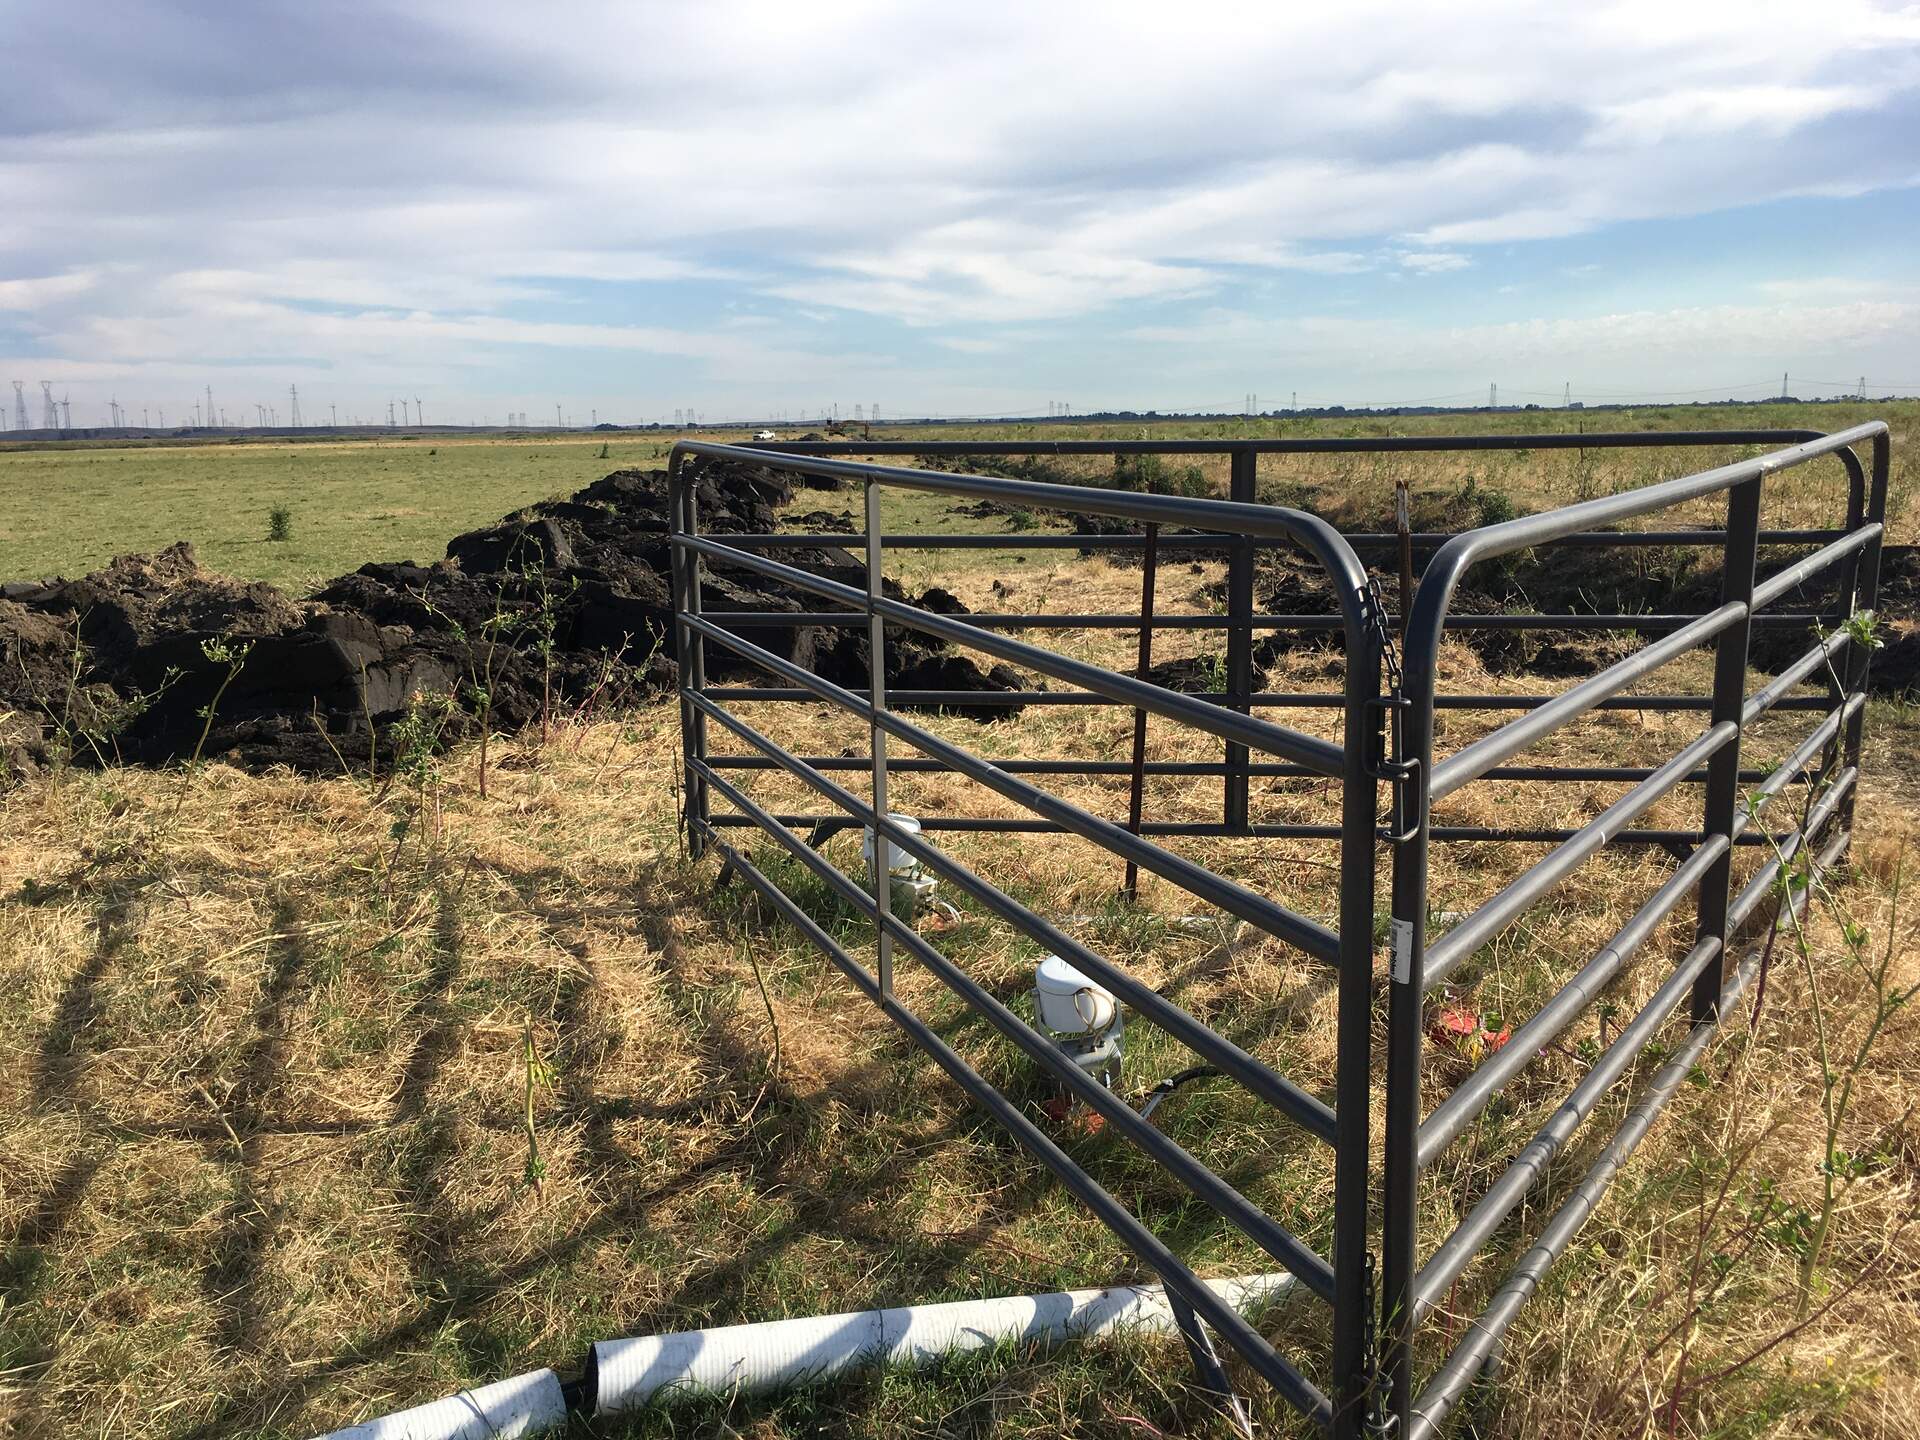
20200529SB_DitchDigging.jpg ( 2020-05-29 00:00:00 ) Full size: 1920x1440
The wetland construction has begun with the ditches getting cleared and deepened
3 sets found
4 SB_flux graphs found
15 SB_met graphs found
Can't check TATWBABCSB_cam