Field Notes

<--2019-12-16 10:15:00 | 2020-01-23 15:15:00-->
Other sites visited today: Mayberry | Sherman Barn | West Pond | East End | East Pond | Bouldin Alfalfa | Bouldin Corn

Sherman Wetland: 2020-01-07 15:20:00 (DOY 7)
Author: Daphne Szutu
Others: Joe, Camilo

Summary: Regular data download/collection, serviced water sensors, updated 7700 wash spin settings, some gaps in PRI_in data

2020-01-07
Sherman Wetland

Joe, Camilo, and I arrived at 15:20 PST. It was a cold day, but mostly sunny with foggy horizons. The wetland was mostly brown but there were some green reeds on patch edges, and some green tule clumps. The water level was 81cm. The precipitation bucket was clean.

Camilo cleaned flux and rad sensors. Joe and I downloaded met, camera, USB, and miniDOT data. The PRI_in data was NAN the past few days but restarted again earlier today before we arrived at the site. The 7500 and 7700 clocks looked ok. I changed the 7700 wash spin from 10 sec to 30 sec to allow enough time to spin away the spray water (7700 wash spray remained at 10 sec). Joe swapped desiccants for the miniDOT and the water level sensor. The wash reservoir was empty; we refilled it.

LI-7500 readings:
CO2 537ppm
H2O -164ppm-->390 after cleaning
T 12.2C
P 101.9kPa
SS 20--> 99 after cleaning
LI7700 readings:
CH4 2.7 ppm
RSSI 43--> 86 after cleaning

We left at 15:40 PST.

1 photos found

King fisher and some ducks
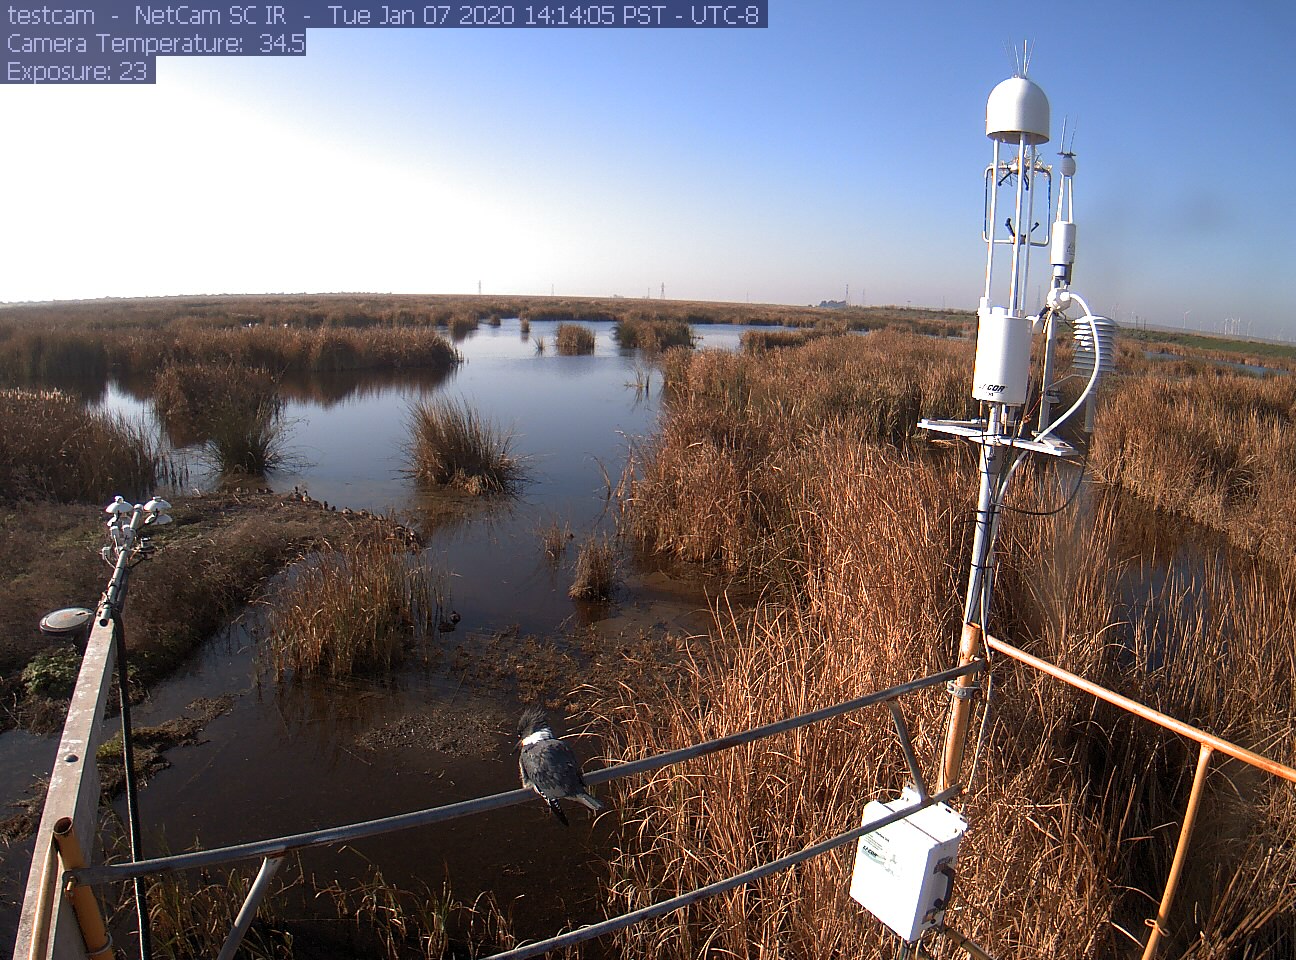
siwetland_2020_01_07_141405.jpg ( 2020-01-07 14:29:24 ) Full size: 1296x960
King fisher and some ducks

Graphs display:
7 sets found

Can't check MBWPEESWGT_mixed
Can't check MBEEWPSWEPGT_cam
16 SW_met graphs found

Explore the graph:Temperatures in a new window

Explore the graph:Water Temperature Profile A in a new window

Explore the graph:Water Temperature Profile B in a new window

Explore the graph:Soil Temperature Profile C2 in a new window

Explore the graph:Soil Heat Flux in a new window

Explore the graph:Four channel Radiometer in a new window

Explore the graph:Sherman Wetland PAR in a new window

Explore the graph:PRI Channels in a new window

Explore the graph:NDVI Channels in a new window

Explore the graph:Water level and Rain in a new window

Explore the graph:Dissolved CO2 in a new window

Explore the graph:Air Pressure in a new window

Explore the graph:Battery Voltage and RH in a new window

Explore the graph:Soil Temperature Profile C1 in a new window

Explore the graph:SRS NDVI and PRI in a new window

Explore the graph:SW miniDOT Dissolved Oxygen in a new window

4 SW_flux graphs found

Explore the graph:CO2 and H2O in a new window

Explore the graph:Wind in a new window

Explore the graph:Methane in a new window

Explore the graph:Data Counts in a new window

Can't check MBSWEEWPBCBA
Can't check SW_Temp
14 SW_Temp graphs found

Explore the graph:Temperatures in a new window

Explore the graph:CO2 and H2O in a new window

Explore the graph:Wind in a new window

Explore the graph:Methane in a new window

Explore the graph:Data Counts in a new window

Explore the graph:Temperature Profile A in a new window

Explore the graph:Temperature Profile B in a new window

Explore the graph:Temperature Profile C in a new window

Explore the graph:Soil Heat Flux in a new window

Explore the graph:Four-channel radiometer in a new window

Explore the graph:NDVI Channels in a new window

Explore the graph:PAR in a new window

Explore the graph:Air Pressure and Water Level in a new window

Explore the graph:Air T and RH in a new window

3 SW_arable graphs found

Explore the graph:Incoming Solar Bands in a new window

Explore the graph:Reflected Solar Bands in a new window

Explore the graph:Solar Radiation in a new window