Field Notes
<--2019-07-02 15:00:00 | 2019-07-25 10:35:00-->Other sites visited today: Mayberry | Sherman Barn | East End | East Pond | West Pond
Phenocam link: Searching...
Sherman Wetland: 2019-07-10 09:15:00 (DOY 191)
Author: Daphne Szutu
Others: Dennis, Camilo
Summary: Regular data collection/cleaning, datalogger hiccup for 12 hours on 4th of July, water level low, checked Mayberry Slough pipes--obsolete?, checked Dutch Slough--no evidence of restoration
| 2019-07-10 Sherman Wetland Camilo, Dennis, and I arrived at 9:15. It was a sunny and windy day with clear skies (some cirrus clouds), and a great view of Mt. Diablo. There were some pelicans in the wetland. The water level is lower than before; a large area under the tower is dry. The water level was 42 cm. Camilo and Dennis cleaned the flux and rad sensors. There was bird poop on the 7700 lower mirror, which is why the RSSI was low and the wash reservoir was empty (we refilled it). Dennis noticed the filters of the upward-facing PRI sensor was starting to degrade. I collected met, cam and USB GHG data. The CR1000 datalogger looks like it lost power or had a hiccup on 2019-07-04 from 9:00 to 18:30: there was no met or camera data, but flux data look ok. LI-7500 readings: CO2 411ppm H2O 755ppm T 21.0C P 101.8kPa SSI 96--> 98 after cleaning LI7700 readings: CH4 3.0ppm--> 1.9 after cleaning RSSI 2.0--> 75 after cleaning On our way out of Mayberry, we checked out the pair of pipes that go across Mayberry Slough. Dennis thought the pipes probably used to carry oil because they didn’t seem to have enough safety features for pressurized gas. We guessed that the pipes were probably defunct and empty. Joe thinks they're still being used, and he's probably right. After finishing our sites, we drove by Dutch Slough. We didn’t see any machinery or evidence that restoration had begun. We left at 9:50. |
1 photos found

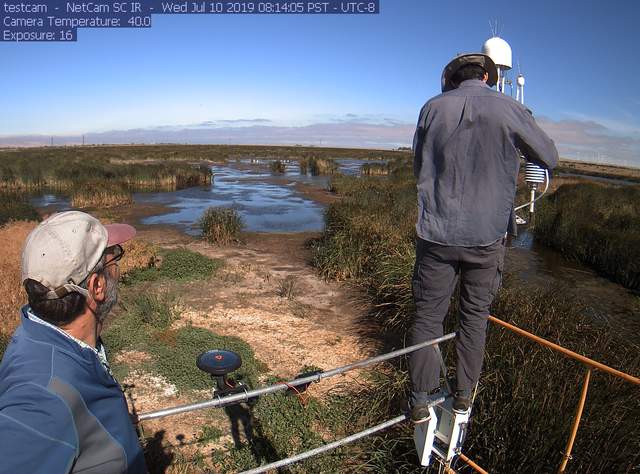
siwetland_2019_07_10_081405.jpg ( 2019-07-10 08:26:44 ) Full size: 1296x960
Dennis and Camilo on site
7 sets found
Can't check MBWPEESWGT_mixed
Can't check MBEEWPSWEPGT_cam
16 SW_met graphs found
4 SW_flux graphs found
Can't check MBSWEEWPBCBA
Can't check SW_Temp
14 SW_Temp graphs found
3 SW_arable graphs found

