
Field Notes
<--2019-05-23 11:37:00 | 2019-06-20 10:40:00-->Other sites visited today: West Pond | East End | East Pond | Sherman Barn | Sherman Wetland | Mayberry | Bouldin Alfalfa
Phenocam link: Searching...
Bouldin Corn: 2019-06-04 12:35:00 (DOY 155)
Author: Robert Shortt
Others: Ariane Ortiz, Daphne Szutu
Summary: Corn in very early stages of growth (~5cm). Soil sensors put out into the field. Tower should be moved closer to field on next visit.
| We arrived at 12:35pm. Weather was hot and sunny, with haze persisting on the horizon. The corn was in its very early stages of growth, with only the baby leaves grown so far. Tyler's chambers are back out in the field. We put the soil heat flux and soil moisture sensors back out into the field, each at ~2cm. Daphne unplugged the Purple Air sensor, downloaded data, and plugged it back in, saw blue blinking light. Saw that the tower's spectral boom was over weeds and is not representative of the field. Should be moved on next visit, but was too heavy for the three of us to shift on our own. Ariane cleaned sensors while Daphne downloaded data and Robert clipped weeds/refilled the wash reservoir (1/3 empty) LI-7500 readings: CO2 411ppm H2O 727ppm T 33.3C P 100.6kPa SS 96.5--> 100 after cleaning LI7700 readings: CH4 1.97ppm RSSI 48-->85 after cleaning |
1 photos found
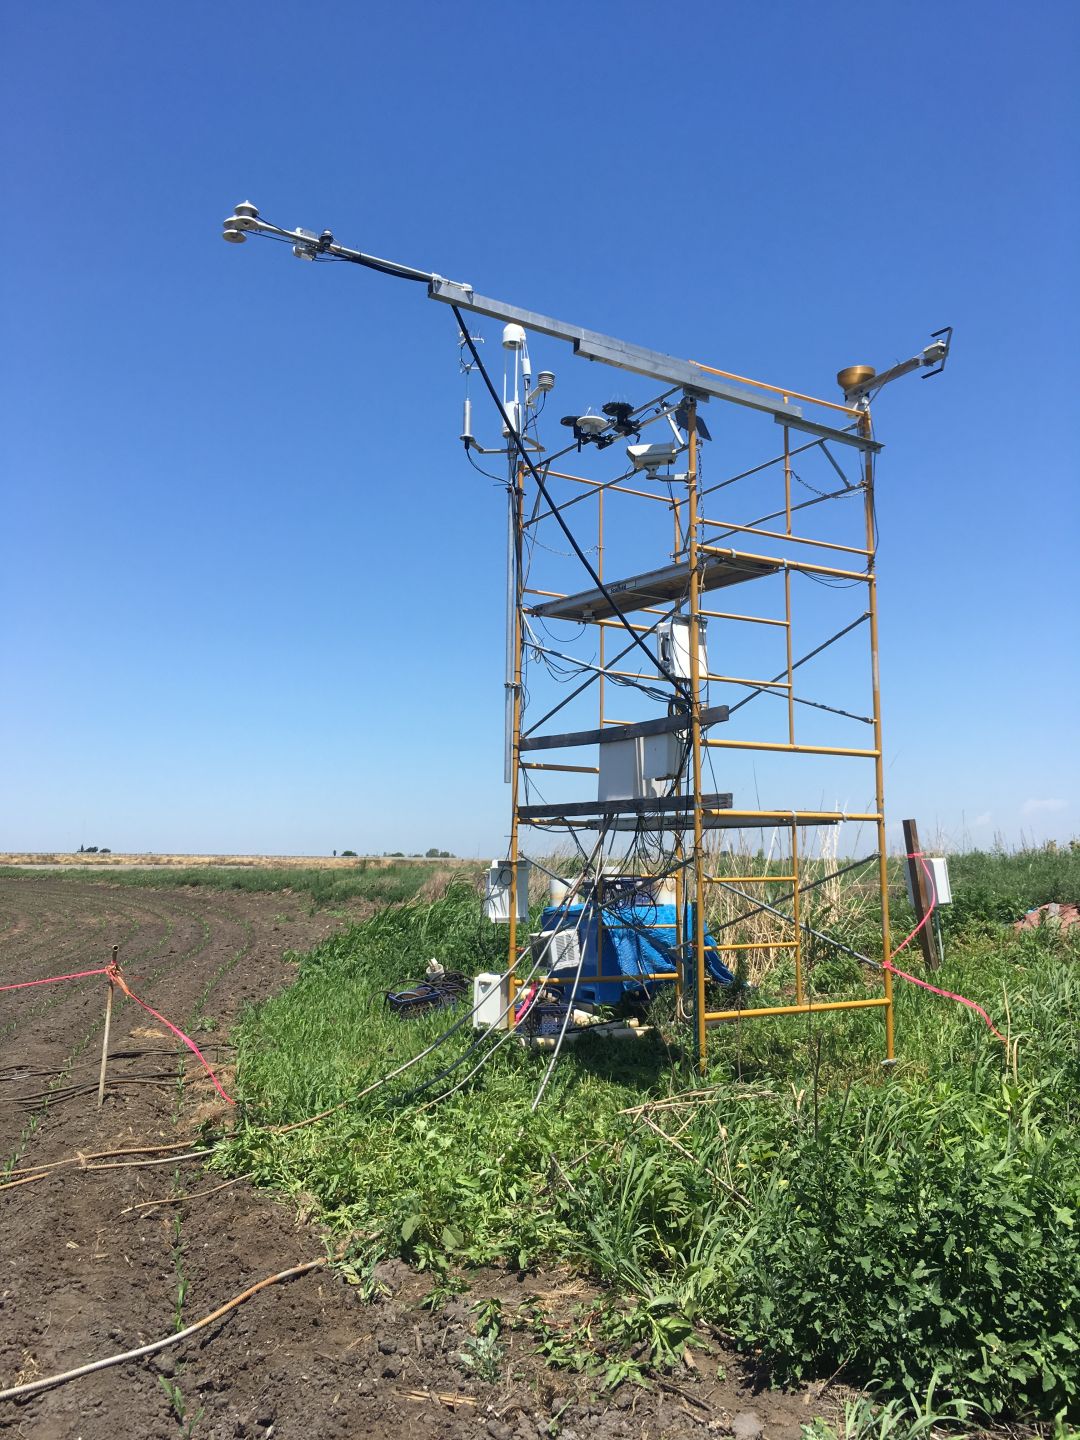
20190605BC_WeedsTower.JPG ( 2019-06-04 13:21:23 ) Full size: 1080x1440
Weeds under BC tower radiometers; we need to move the tower closer into the field.
6 sets found
17 BC_met graphs found
5 BC_flux graphs found
Can't check TATWBABCSB_cam
Can't check MBSWEEWPBCBA
2 BC_pa graphs found
1 BC_arable graphs found