
Field Notes
<--2019-06-04 12:35:00 | 2019-07-11 07:30:00-->Other sites visited today: Mayberry | Sherman Barn | Sherman Wetland | West Pond | East End | East Pond | Bouldin Alfalfa
Phenocam link: Searching...
Bouldin Corn: 2019-06-20 10:40:00 (DOY 171)
Author: Daphne Szutu
Others: Kuno, Robert, Camilo
Summary: Regular data collection/cleaning, veg height, LAI, installed 2 zcams and sonic rangefinder, uploaded new CR1000 program, removed Arable, moved tower into field
| 2019-06-20 Bouldin Corn Kuno, Robert, Camilo, and I arrived at 10:40. It was sunny and windy with clear skies. The corn is about knee height. A farmworker was spraying with a tractor on the field to our east; luckily the wind was blowing briskly from the west. Roundup Power Max Herbicide - 48.7% Glyphosate with surfactant Cayuse Plus - adjuvant to increase herbicide efficiency. Ammonium ions (AMS) increase uptake of herbicide by plants and non-ionic surfactant (NIS) increases contact between herbicide and plant. Crosshair - adjuvant DRT (drift reduction technology) that reduces the number of spray droplets that are prone to drift (<105 um) but do not increase the size of larger droplets Robert took veg height and LAI measurements. Kuno installed the two z-cams in the corn; one between the corn rows and one underneath the corn canopy. Camilo cleaned flux and rad sensors, removed the original Arable sn A001911 to bring back to the lab for now, and installed the sonic rangefinder sn URM06-001 that we had just removed from BA. I downloaded met, cam, and USB GHG data. I didn’t get the PA data because I forgot the card reader. The wash reservoir was 1/3 empty; and we refilled it. The four of us moved the tower about 2 m to the west, so the tower’s western feet were lined up with the first corn row. We scrounged around for materials to tie up the adjustable feet to the scaffolding, and removed the lower boardwalk (the upper boardwalk had the Purple Air sensor). We leveled the tower and Camilo checked the level on the flux sensors and checked the sonic orientation: 0 degrees (didn’t change). We left the soil sensors where they were and didn’t need to extend the tower’s power cable. We moved the grounding rod and the fence posts, although it was hard to get them in very far with a hammer, so we used a shovel to dig a small hole to install them. The well is about 1 m east of the tower and its cable was the perfect height to trip over, so we tied on some orange flagging tape. Tyler’s orange power cord to his soil sensor datalogger box is stretched out fully. I checked the flux and met data after the move, and all seems ok. I wired in the sonic rangefinder and updated the CR1000 program. LI-7500 readings: CO2 400ppm-->415 after the move H2O 662ppm-->530 after the move T 21.8C-->23.8 after the move P 100.5kPa-->100.7 after the move SS 96-->98 after cleaning--> 99 after the move (became cleaner?) LI7700 readings: CH4 1.89ppm-->1.9 after the move RSSI 50-->84 after cleaning-->82 after the move We left around 12:30. |
Veg Height (cm): Tape measure from ground to top of plant - Measurements taken in NE transect across footprint. ~5m between measurements.
51, 51, 28, 36, 56, 37, 35, 31, 63, 44, avg = 43.2, stdev = 11.62
4 photos found

20190620BC_Chemicals.jpg ( 2019-06-20 00:00:00 ) Full size: 1440x1920
Various chemicals seen in the back of a truck by the Bouldin Duck Club.

20190620BC_CanopyPicam.jpg ( 2019-06-20 12:14:36 ) Full size: 1920x1080
Picam installed under the corn canopy to measure gap fraction.
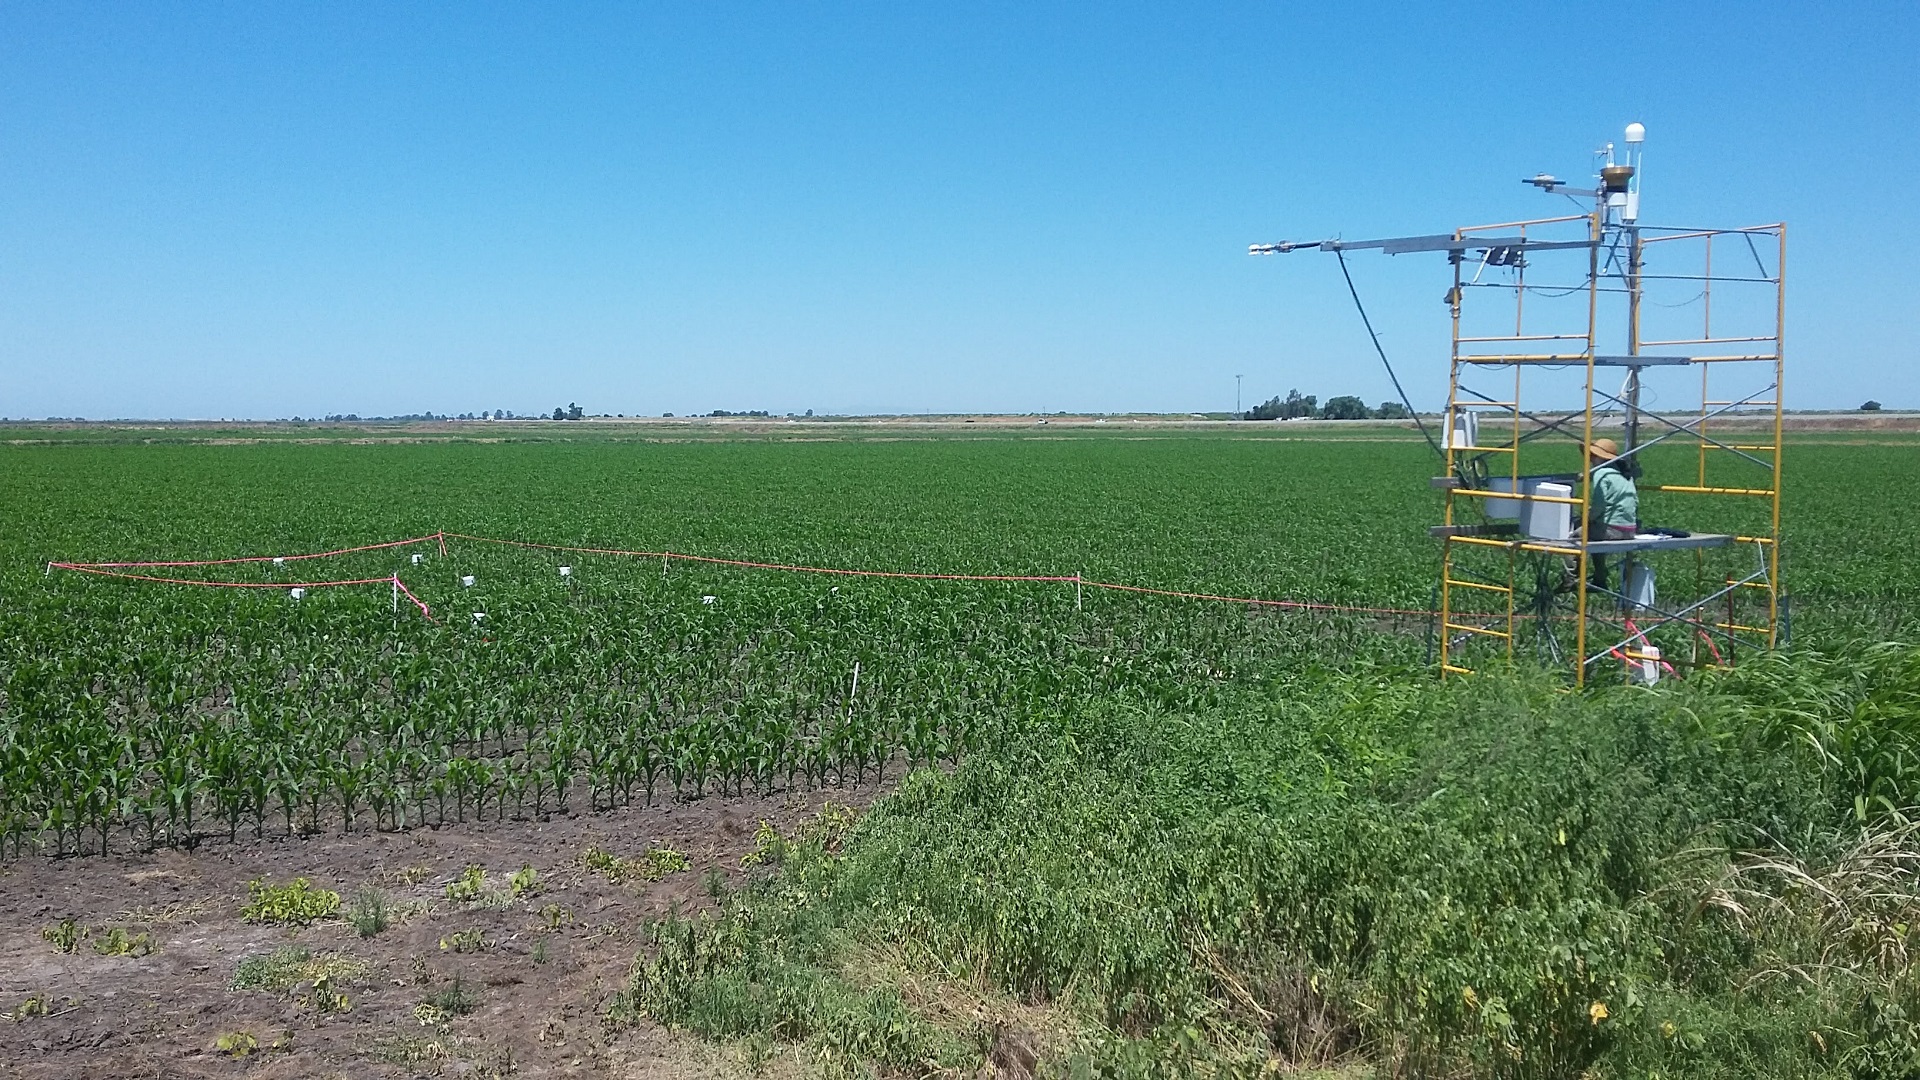
20190620BC_GrowingCorn.jpg ( 2019-06-20 12:12:31 ) Full size: 1920x1080
We moved the tower about 2m to the west so that the legs were on the edge of the first corn row. The corn was planted about 3-4 weeks ago on 2019-05-25.

20190620BC_IntercanopyPicam.jpg ( 2019-06-20 12:12:59 ) Full size: 1920x1080
Picam installed in the corn intercanopy to measure gap fraction.
6 sets found
17 BC_met graphs found
5 BC_flux graphs found
Can't check TATWBABCSB_cam
Can't check MBSWEEWPBCBA
2 BC_pa graphs found
1 BC_arable graphs found