
Field Notes
<--2018-06-27 10:25:00 | 2018-07-05 13:20:00-->Other sites visited today: East End | Bouldin Alfalfa | Bouldin Corn | West Pond | Sherman Wetland | Mayberry
Phenocam link: Searching...
East Pond: 2018-06-28 11:35:00 (DOY 179)
Author: Daphne Szutu
Others: Sam, Katrina
Summary: Raised flux sensors ~30cm
| 2018-06-28 East Pond We arrived at 11:35. It was warm, clear, sunny, and breezy. There was more water this week, with standing water on top of the muck. The water level was 68cm. The site is still losing power at night since 5/25. Sam raised the flux sensors (LI-7500 sn 0418, LI-7700 sn TG1-0211, sonic sn 153803) about 30cm. We’ll probably need to lower it in the future to clean it, so we should install an anchoring bolt so we can return it to the same height and orientation each time. Distance from middle of sonic to water surface: 5.40m Distance from middle of sonic to top surface of bottom boardwalk: 4.03m I collected the USB GHG data immediately after the sensors were raised. I did not collect other data because I had collected it the previous day. LI-7500 readings (original height --> raised height): CO2 395ppm --> 397 H2O 540ppm --> 575 T 24.6C --> 24.7 P 101.6kPa --> 101.6 SS 96 --> 96 LI7700 readings (original height --> raised height): CH4 1.96ppm --> 2.0 RSSI 52ppm --> 50ppm after cleaning We left at 11:50. |
1 photos found
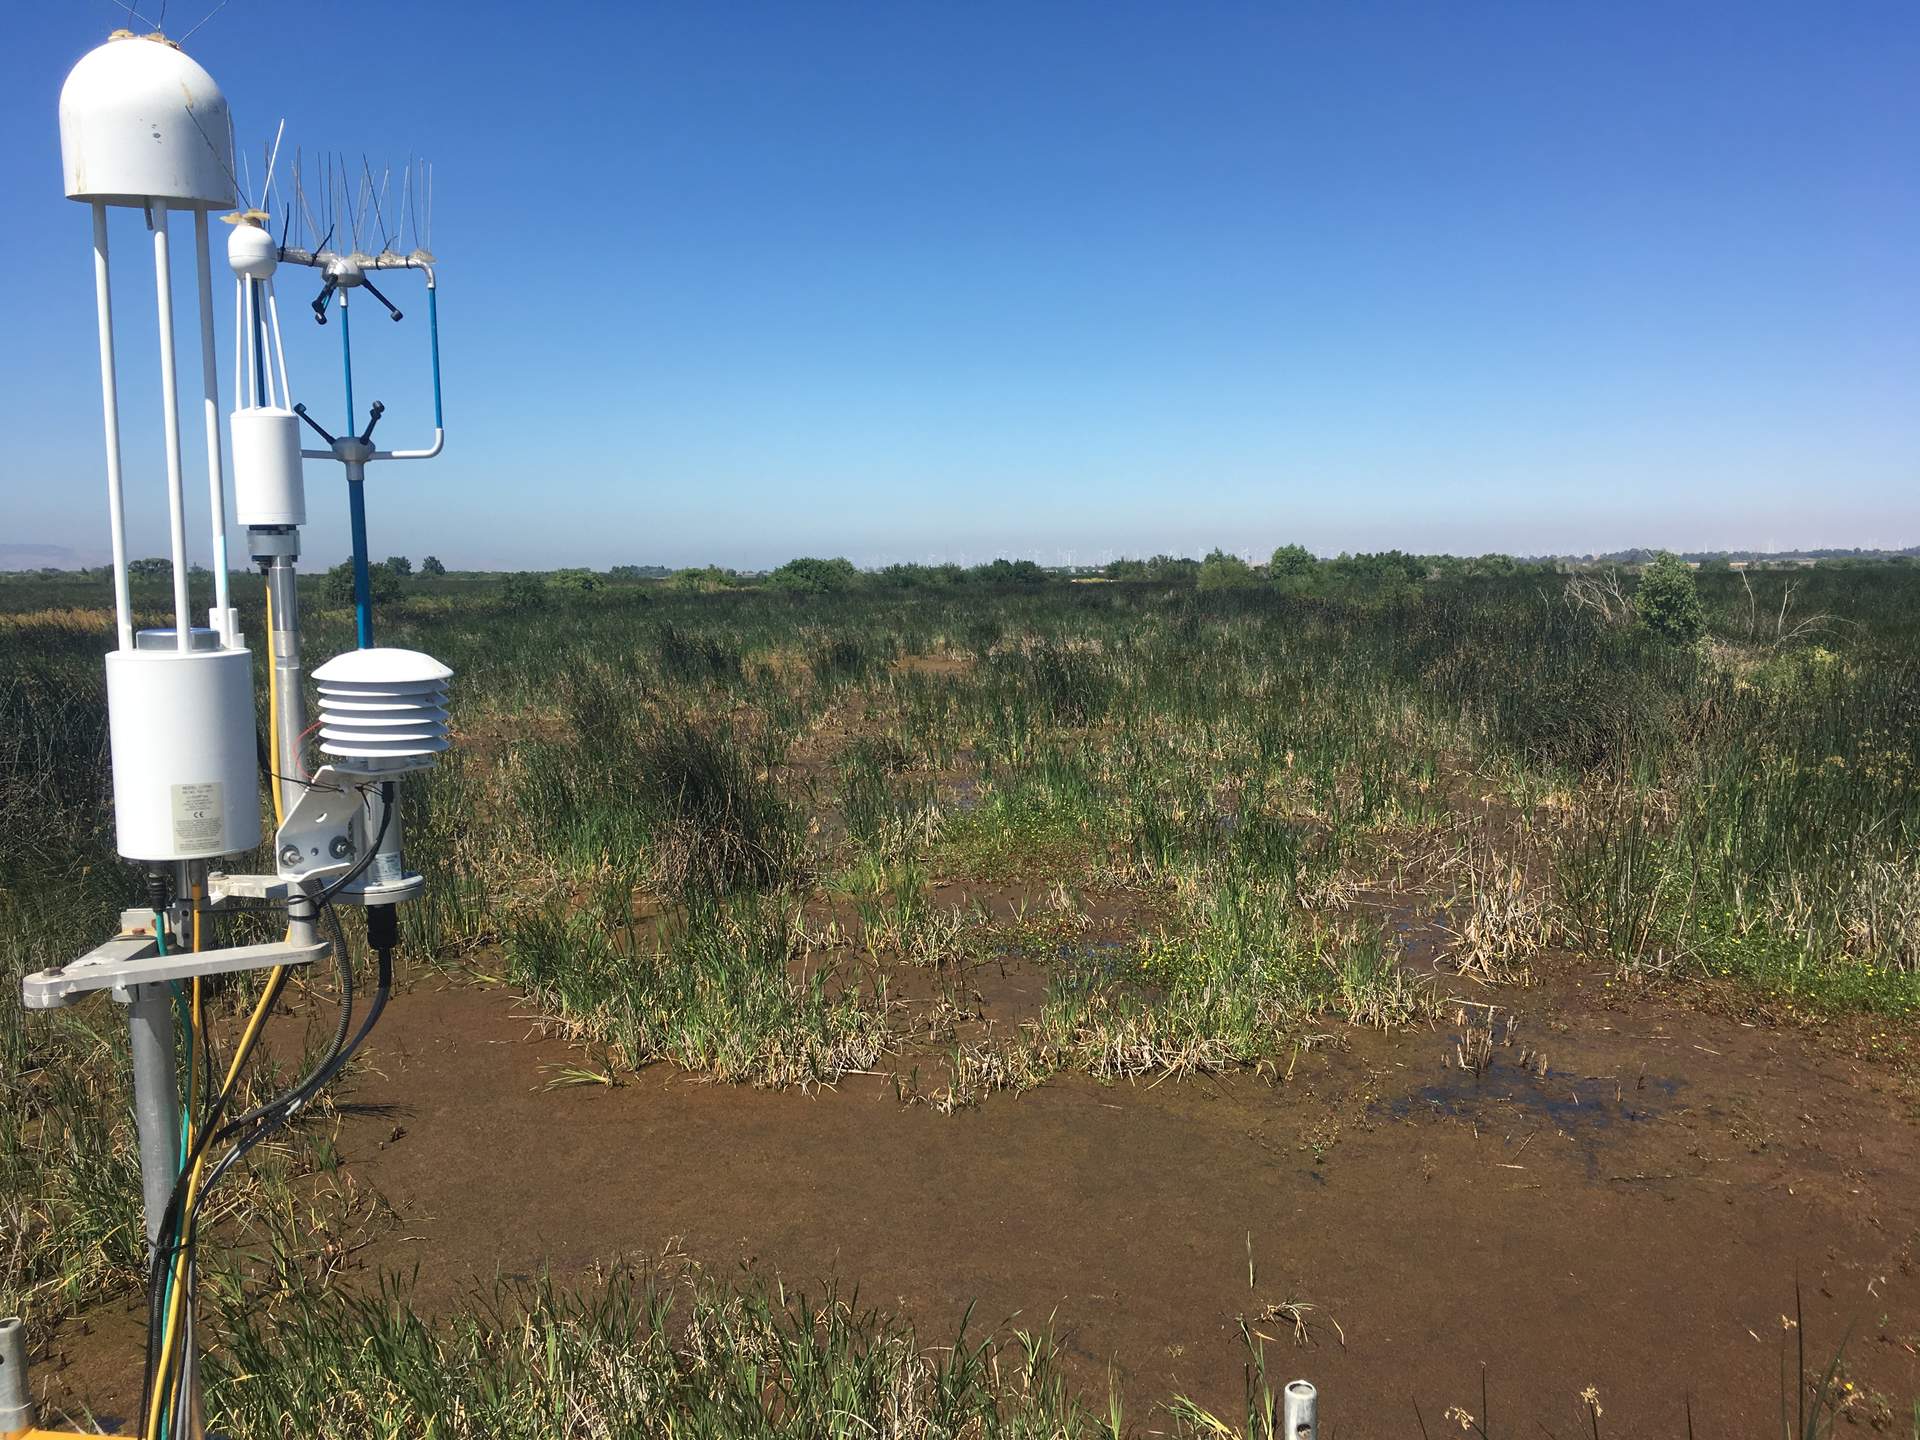
20180627EP_Footprint.jpg ( 2018-06-27 10:42:47 ) Full size: 1920x1440
View of the footprint area
5 sets found
Can't check MBEEWPSWEPGT_cam
9 EP_met graphs found
4 EP_flux graphs found
Can't check EP_hobo
1 EP_hobo graphs found
Can't check EP_level1
3 EP_level1 graphs found