Field Notes
<--2007-08-01 00:00:00 |
2007-08-12 17:30:00-->
Other sites visited today:
Sherman Island
Phenocam link:
Searching...Tonzi: 2007-08-10 10:00:00 (DOY 222)
Author: Siyan Ma
Others: Dennis
When: Date: 8/10/2007 , Day: 222 ,
Watch Time: 10:00m .
Where: Tonzi/Vaira Ranch
Who: Siyan, DDB
Weather:
clear, nice breeze
Phenology:
yellow grass; a lot of tree leaves turn to yellow (~30%) and leaves started to drop.
DDB
talked to Mr. Toniz. Mr. Tonzi mentioned
that grazing intensity is around 100 cows per 900 acres.
Julian
Hadley visited the sites.
Summary
- Three EC system worked
well. Data were download.
- Tower computer: “No signals” on the Screen.
- Dendrometers were reset to
zero. Initial settings were recorded.
- Soil CO2 profile sensors were
pulled out of soil for zero comparison.
Sensors were taken back to the lab for calibration check.
- Computer at the floor site
lost the communication with soil CO2 profile datalogger a few minutes after
a successful connection. Data at 14:00pm did not wrote to CR23X3.dat.
Vaira_Grass
Site
- Fence and gate power: 12
v.
- Panel and Batteries: 13.5 v; 13.4 amps; 3.4 amps.
- Reading from Gillsonic screen
before downloading data. (The value
of H2O and CO2 should be in the range of 0 – 5 v.)
Time
|
|
Path/File name
|
D:\Data\V07_ 222
.flx
D:\Data\VR07 .raw
|
|
mean
|
std
|
|
mean
|
std
|
w
|
0.22
|
0.34
|
Ts
|
28.2
|
0.074
|
u
|
1.89
|
0.62
|
H2O
|
1.7
|
0.02
|
v
|
|
|
CO2
|
1.6
|
0.029
|
|
|
|
Tc
|
2.42
|
0.093
|
- check the fans of air temp.
and relative humidity sensors at Vaira. Good.
- Check MD-9 system connections:
Good.
- Check levels of Radiation
sensors, clear up surfaces. Done!
- Closed gate and set up fence.
Yes.
Tonzi_Tower Site
- Fence and gate power: 12
v.
- Panel and Batteries: 13.4 v; 0.0 amps; 4.1 amps.
- Reading from Gillsonic screen
before downloading data. (The value
of H2O and CO2 should be in the range of 0 – 5 v.)
- “No signals” on the Screen.
Time
|
|
Path/File name
|
D:\Data\T07_ 174 .flx
D:\Data\TW07 .raw
|
|
mean
|
std
|
|
mean
|
std
|
w
|
0.18
|
0.643
|
Ts
|
27.151
|
0.106
|
u
|
1.54
|
1.669
|
H2O
|
3.111
|
0.211
|
v
|
2.8
|
1.329
|
CO2
|
1.543
|
0.128
|
- download data
- check the fans of air temp.
and relative humidity sensors on the tower and the floor.
- Check calibration cylinders;
CO 2 800 psig; flow 20
psi.
N 2 350
psig; flow 20 psi. (It may be low!)
Manually calibrate Li-800. Following Ted’s instruction: H:\IoneSavanna_2004\Tower_2004\CO2Profile\LI800_Calibration_Procedure_2Nov04.txt
Is the pump running Yes.
|
1
|
2
|
3
|
4
|
|
zero
|
span
|
CO2_P
|
378.1
|
379.1
|
377.8
|
377.5
|
|
-0.33
|
424
|
Press
|
938.3
|
931.4
|
931.7
|
931.9
|
|
942
|
940.8
|
S_temp
|
45.9
|
46
|
46
|
45.9
|
|
455
|
45.4
|
C_temp
|
50.1
|
50
|
50.1
|
50.9
|
|
49.7
|
49.7
|
How to check the CO2 values
Click “Ports/Flags” button to see which ports or flags is setting
high. Pressure should be less than
ambient value. When Flag 8 is high, it
may indicate that RRR’s battery is low.
- close gate and set up fence. Yes.
Toniz_Floor
Site
- Fence and gate power: 12
v.
- Panel and Batteries: 13.3 v; 12.6 amps; 2.1 amps.
- Reading from Gillsonic screen
before downloading data. (The value
of H2O and CO2 should be in the range of 0 – 5 v.)
Time
|
|
Path/File name
|
D:\Data\F07_
174 .flx
D:\Data\FL07 .raw
|
|
mean
|
std
|
|
mean
|
std
|
w
|
-0.03
|
|
Ts
|
28.7
|
|
u
|
0.07
|
|
H2O
|
2.11
|
|
v
|
1.19
|
|
CO2
|
1.662
|
|
- download data
- Check MD-9 system connections.
Sometimes it is Good, but sometimes it is
not.
- Soil CO2 profile: Soil CO2 profile sensors were pulled
out of soil for zero comparison.
Sensors were taken back to the lab for calibration check.
Reading
from panels of analyzers before pulling out:
depth
|
Open
|
temp
|
order
|
|
In
the air
|
2cm
(1%)
|
201.98
|
40.3
|
1
|
520
|
410
|
4cm
|
223.85
|
48.4
|
2
|
580
|
440
|
8cm
|
179.3
|
36.2
|
3
|
670
|
430
|
16cm
|
135.59
|
30.1
|
4
|
810
|
620
|
depth
|
Tree
|
temp
|
order
|
|
|
2cm
(1%)
|
169.03
|
28.9
|
1
|
690
|
390
|
4cm
|
139.89
|
24.0
|
4
|
1900
|
360
|
8cm
|
142.87
|
27.6
|
2
|
780
|
310
|
16cm
|
218.4
|
23.0
|
3
|
0.31%
|
0.10%
|
- Close gate and set up fence. Yes.
Dendrometers were reset to zero. Initial
settings were recorded.
Tonzi
|
|
|
|
|
|
Dendrometer
|
|
|
|
|
|
|
|
|
Reset-up
|
|
Date
|
Day
|
Tag #
|
Reading (cm)
|
Initial reading
|
|
8/10/2007
|
222
|
71
|
23.9
|
Broken
|
|
|
|
72
|
23.3
|
0.5
|
|
|
|
77
|
Broken
|
Broken
|
|
|
|
78
|
Broken
|
Broken
|
|
|
|
79
|
22.9
|
3.9
|
|
|
|
245
|
23.7
|
1.6
|
|
|
|
248
|
24.4
|
2.9
|
|
|
|
250
|
21.5
|
1.4
|
|
|
|
255
|
broken
|
Broken
|
|
|
|
252
|
missing
|
Broken
|
|
|
|
102
|
reset
|
4.1
|
|
|
Field Data
No tank data
No TZ Well data found
No TZ Moisture Point data found
No VR Moisture Point data found
No TZ grass heigth found
No VR grass heigth found
No TZ Tree DBH found
Water Potential - mode: raw
| Time | Species | Tree | readings (bar) |
|---|
| 2007-08-10 05:16:00 |
OAK |
255 |
-38 |
-44 |
-46 |
-35 |
-46 |
-38 |
| 2007-08-10 05:31:00 |
OAK |
102 |
-40 |
-38 |
-41 |
-39 |
-40 |
|
No TZ Grass Biomass data found
No TZ OakLeaves Biomass data found
No TZ PineNeedles Biomass data found
0 photos found
16 sets found
No data found for TZ_Fenergy.
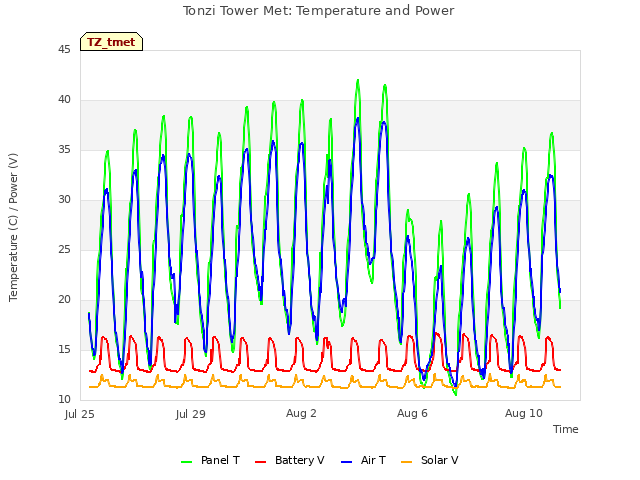
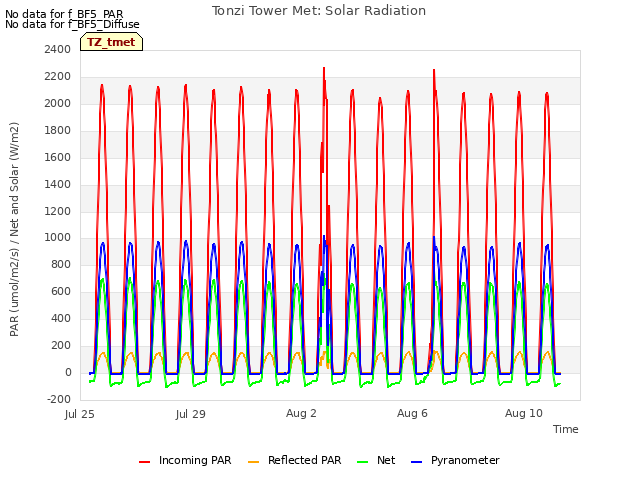
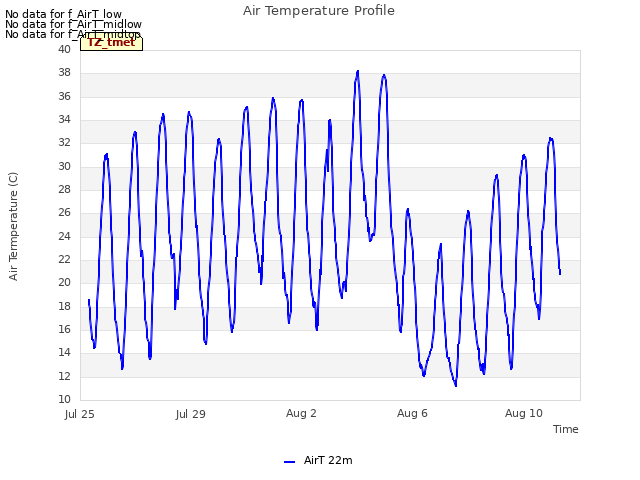
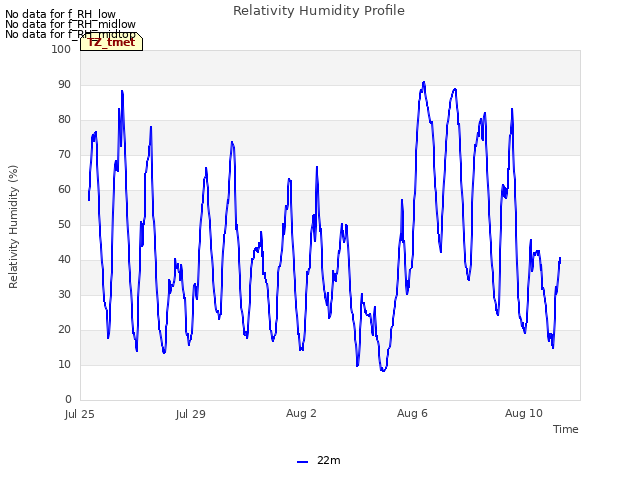
11 TZ_tmet graphs found


No data found for TZ_soilco2.
Can't check TZ_mixed
3 TZ_mixed graphs found

No data found for TZ_fflux.
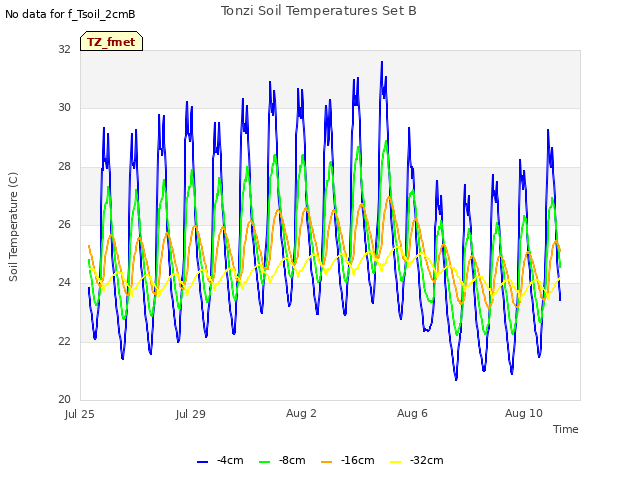
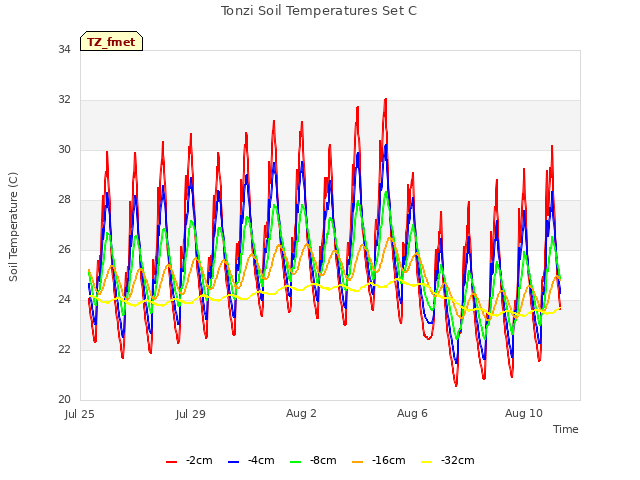
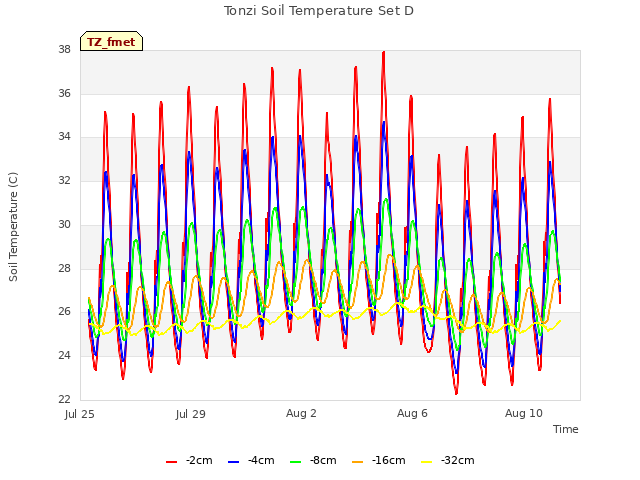
8 TZ_fmet graphs found


No data found for TZ_tram.
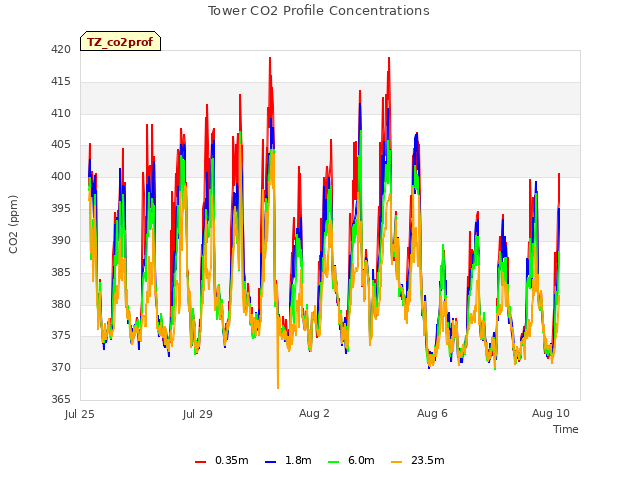
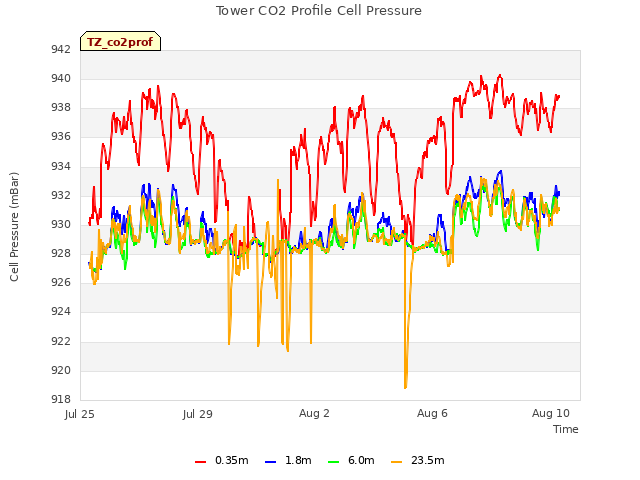
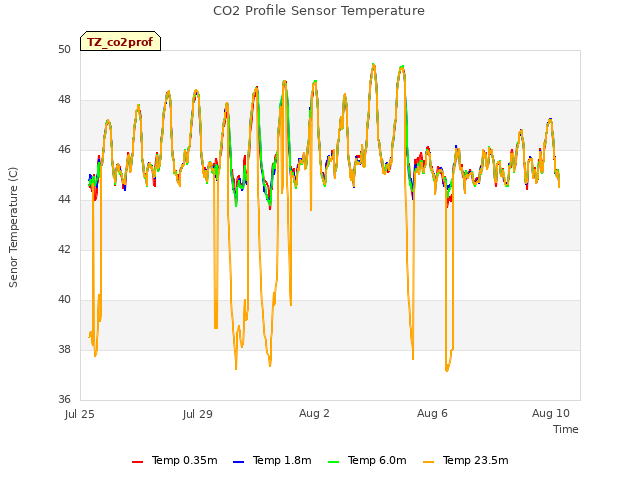
3 TZ_co2prof graphs found
No data found for TZ_irt.
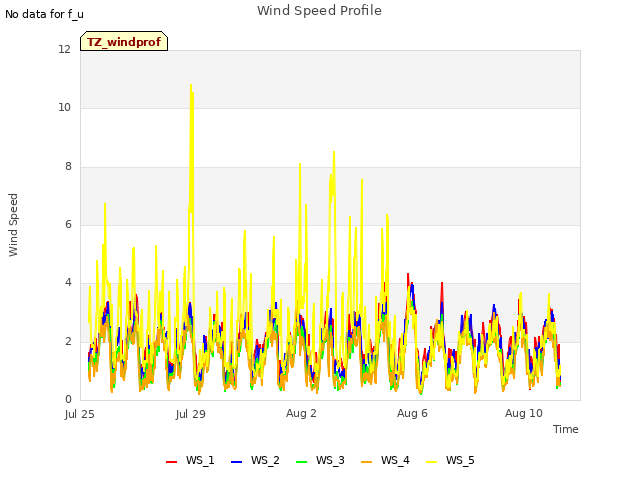
1 TZ_windprof graphs found
No data found for TZ_tflux.
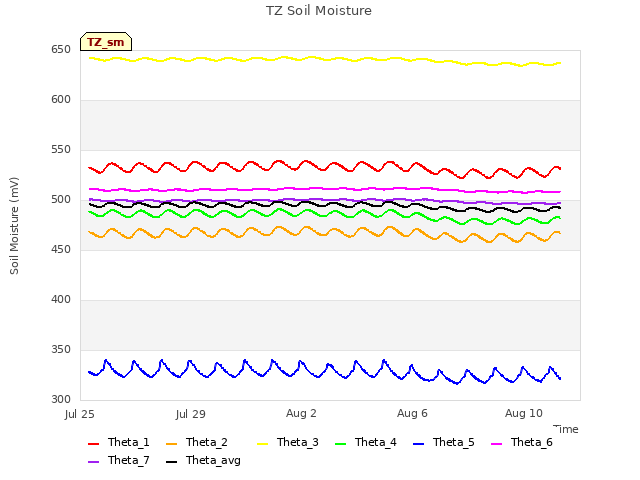
2 TZ_sm graphs found

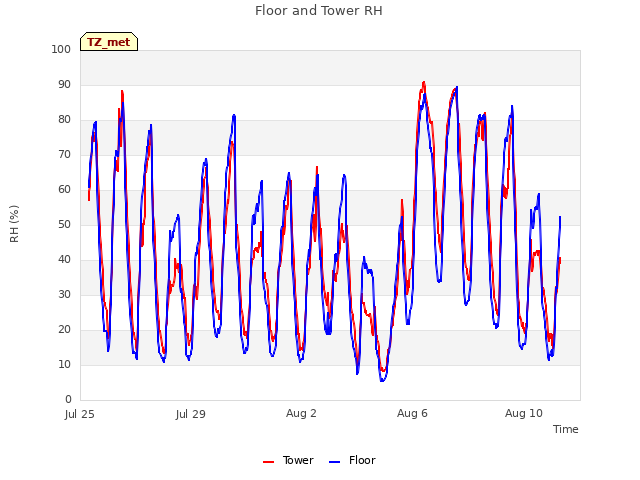
Can't check TZ_met
1 TZ_met graphs found
Can't check TZVR_mixed
No data found for TZ_osu.
No data found for TZ_fd.
Tonzi Z-cam data


