
Field Notes
<--2017-01-17 10:30:00 | 2017-01-31 12:00:00-->Other sites visited today: Mayberry | Sherman Wetland | Bouldin Alfalfa | East End | West Pond | Twitchell Alfalfa | Twitchell Rice | Tonzi | Vaira
Phenocam link: Searching...
Tonzi: 2017-01-17 11:30:00 (DOY 17)
Author: Joe Verfaillie
Others: Siyan, Miriam Johnston
Summary: very wet, pond much higher, removed bad batteries from Tower battery bank, cut down dead tree near Tower, swapped Floor 7500, resealed z-cam windows.
| Tonzi 2017-01-17 I arrived about 11:30am with Siyan and Miriam Johnston. Miriam is a PhD student visiting from the Moorcroft lab at Harvard University. She will be running a model using Tonzi/Vaira data. The Delta and Central Valley were foggy but here it’s just hazy and cool with a breeze from the north. The Sacramento River is running high with some flooding on the river side of the levees. The Cosumnes is a little bit lower than two weeks ago. I met Rob Conkling who was out cutting fire wood. He said there had been a lot of rain and high wind in the last week. I asked him about the dead tree near the tower guy wires on the southwest corner and he cut it down right then and there. He felled it to the north away from the guy wires and will leave it where it fell until the ground dries out so he can get in with a truck to cut it up for firewood. Rob also said he’s notice a lot of small trees dying due to the drought and that the dead ones have lots of insect damage. The Tower has been losing power over night recently. Miriam and I disconnected all the batteries and tested them with the load tester. Four batteries tested bad. We removed them and reconnected the others. The CO2 profile system is still off. I collected data, Siyan did the standard fieldwork. We checked and swapped the 7500 on the Floor tower - sn 0073 came off and sn 0418 went on. The CO2 calibration coefficients on 0073 got messed up somehow after its last calibration and CO2 was reading about 519ppm low, but the signal looked okay. I resealed the windows on z-cam 2 and 3 with silicone. They were temporarily held on with putty and there was a little bit on condensation on the inside of the glass. |
Field Data
No tank data
Well Depth
| Date | Location | Depth (feet) |
|---|---|---|
| 2017-01-17 | TZ_floor | 23.9 |
| 2017-01-17 | TZ_road | 31.1 |
| 2017-01-17 | TZ_tower | 27 |
mode = both
Moisture Point Probes TZ
Array
(
[0] => Tower_1
[1] => Floor_South_1
[2] => Floor_West_1
[3] => SoilCO2_1
[4] => Soil_Transect_4_1
[5] => Soil_Transect_3_1
[6] => Soil_Transect_2_1
[7] => Soil_Transect_1_1
[8] => SoilCO2_West_A_1
[9] => SoilCO2_West_B_1
[10] => SoilCO2_West_C_1
[11] => Tower_2
[12] => Floor_South_2
[13] => Floor_West_2
[14] => SoilCO2_2
[15] => Soil_Transect_4_2
[16] => Soil_Transect_3_2
[17] => Soil_Transect_2_2
[18] => Soil_Transect_1_2
[19] => SoilCO2_West_A_2
[20] => SoilCO2_West_B_2
[21] => SoilCO2_West_C_2
[22] => Tower_3
[23] => Floor_South_3
[24] => Floor_West_3
[25] => SoilCO2_3
[26] => Soil_Transect_4_3
[27] => Soil_Transect_3_3
[28] => Soil_Transect_2_3
[29] => Soil_Transect_1_3
[30] => SoilCO2_West_A_3
[31] => SoilCO2_West_B_3
[32] => SoilCO2_West_C_3
[33] => Tower_4
[34] => Floor_South_4
[35] => Floor_West_4
[36] => SoilCO2_4
[37] => Soil_Transect_4_4
[38] => Soil_Transect_3_4
[39] => Soil_Transect_2_4
[40] => Soil_Transect_1_4
[41] => SoilCO2_West_A_4
[42] => SoilCO2_West_B_4
[43] => SoilCO2_West_C_4
)
| Date | DOY | Rep | Depth | Tower_1 |
Floor_South_1 |
Floor_West_1 |
SoilCO2_1 |
Soil_Transect_4_1 |
Soil_Transect_3_1 |
Soil_Transect_2_1 |
Soil_Transect_1_1 |
SoilCO2_West_A_1 |
SoilCO2_West_B_1 |
SoilCO2_West_C_1 |
Tower_2 |
Floor_South_2 |
Floor_West_2 |
SoilCO2_2 |
Soil_Transect_4_2 |
Soil_Transect_3_2 |
Soil_Transect_2_2 |
Soil_Transect_1_2 |
SoilCO2_West_A_2 |
SoilCO2_West_B_2 |
SoilCO2_West_C_2 |
Tower_3 |
Floor_South_3 |
Floor_West_3 |
SoilCO2_3 |
Soil_Transect_4_3 |
Soil_Transect_3_3 |
Soil_Transect_2_3 |
Soil_Transect_1_3 |
SoilCO2_West_A_3 |
SoilCO2_West_B_3 |
SoilCO2_West_C_3 |
Tower_4 |
Floor_South_4 |
Floor_West_4 |
SoilCO2_4 |
Soil_Transect_4_4 |
Soil_Transect_3_4 |
Soil_Transect_2_4 |
Soil_Transect_1_4 |
SoilCO2_West_A_4 |
SoilCO2_West_B_4 |
SoilCO2_West_C_4 |
Avg | Spacial Count |
Measurement Count |
|---|---|---|---|---|---|---|---|---|---|---|---|---|---|---|---|---|---|---|---|---|---|---|---|---|---|---|---|---|---|---|---|---|---|---|---|---|---|---|---|---|---|---|---|---|---|---|---|---|---|---|
| 2017-01-17 | 17 | 0 | nan | 36.7 | 32.9 | 37.9 | 38.4 | 32.6 | 22.3 | 29.1 | 33.8 | 33.8 | 32 | 35.5 | 44.8 | 43.9 | 39.6 | 39.9 | 39.9 | 34.1 | 33 | 28.6 | 32.9 | 30.4 | 34.4 | 38.8 | 42.7 | 41.9 | 46 | 38.8 | 35.4 | 36.8 | 37.4 | 36.6 | 39.6 | 37.4 | 39.5 | 57.2 | 45.4 | 41.7 | 35.7 | 45.4 | 47.1 | 39.4 | 45.4 | 50 | 49.1 | |||
| 2017-01-17 | 17 | 1 | nan | 37 | 37.6 | 32.3 | 23.8 | 28.2 | 34.1 | 33.8 | 44.8 | 39.9 | 39.1 | 33.8 | 33.2 | 28.3 | 33.2 | 39.4 | 41.3 | 39.1 | 34.9 | 36 | 36.8 | 36.8 | 38.8 | 44.8 | 35.7 | 44.8 | 48.6 | 39.1 | 44.3 | |||||||||||||||||||
| 2017-01-17 | 17 | Avg | 0-15cm | 0 | 0 | |||||||||||||||||||||||||||||||||||||||||||||
| 2017-01-17 | 17 | Avg | 15-30cm | 0 | 0 | |||||||||||||||||||||||||||||||||||||||||||||
| 2017-01-17 | 17 | Avg | 30-45cm | 0 | 0 | |||||||||||||||||||||||||||||||||||||||||||||
| 2017-01-17 | 17 | Avg | 45-60cm | 0 | 0 |
mode = both
Moisture Point Probes VR
Array
(
[0] => Solar_Panels_1
[1] => Flux_Tower_1
[2] => Gate_1
[3] => Biomass_Cage_1
[4] => Flux_Tower_2
[5] => Gate_2
[6] => Biomass_Cage_2
[7] => Solar_Panels_3
[8] => Flux_Tower_3
[9] => Gate_3
[10] => Biomass_Cage_3
[11] => Solar_Panels_4
[12] => Flux_Tower_4
[13] => Gate_4
[14] => Biomass_Cage_4
[15] => Solar_Panels_2
)
| Date | DOY | Rep | Depth | Solar_Panels_1 |
Flux_Tower_1 |
Gate_1 |
Biomass_Cage_1 |
Flux_Tower_2 |
Gate_2 |
Biomass_Cage_2 |
Solar_Panels_3 |
Flux_Tower_3 |
Gate_3 |
Biomass_Cage_3 |
Solar_Panels_4 |
Flux_Tower_4 |
Gate_4 |
Biomass_Cage_4 |
Solar_Panels_2 |
Avg | Spacial Count |
Measurement Count |
|---|---|---|---|---|---|---|---|---|---|---|---|---|---|---|---|---|---|---|---|---|---|---|
| 2017-01-17 | 17 | 0 | nan | 34.1 | 18.5 | 37.9 | 12.7 | 69.2 | 21.3 | 25.8 | 31.6 | 26.8 | 26.2 | 32.9 | 43.8 | 26.2 | 23.1 | 33.1 | ||||
| 2017-01-17 | 17 | 1 | nan | 33.8 | 28.2 | 37.3 | 13 | 31.6 | 21.9 | 24.6 | 31.8 | 27.4 | 26.9 | 32.9 | 42.5 | 24.8 | 23.4 | 33.1 | 31 | |||
| 2017-01-17 | 17 | Avg | 0-15cm | 0 | 0 | |||||||||||||||||
| 2017-01-17 | 17 | Avg | 15-30cm | 0 | 0 | |||||||||||||||||
| 2017-01-17 | 17 | Avg | 30-45cm | 0 | 0 | |||||||||||||||||
| 2017-01-17 | 17 | Avg | 45-60cm | 0 | 0 |
No TZ grass heigth found
No VR grass heigth found
Tree DBH
| Date | Tag# | Reading (mm) |
|---|---|---|
| 2017-01-17 | 1 | 25.5 |
| 2017-01-17 | 102 | 23.0 |
| 2017-01-17 | 2 | 19.8 |
| 2017-01-17 | 245 | 23.2 |
| 2017-01-17 | 3 | 23.9 |
| 2017-01-17 | 4 | 20.0 |
| 2017-01-17 | 5 | 21.0 |
| 2017-01-17 | 7 | 17.5 |
| 2017-01-17 | 72 | 23.5 |
| 2017-01-17 | 79 | 23.3 |
| 2017-01-17 | 8 | 20.8 |
No water potential data found
No TZ Grass Biomass data found
No TZ OakLeaves Biomass data found
No TZ PineNeedles Biomass data found
3 photos found
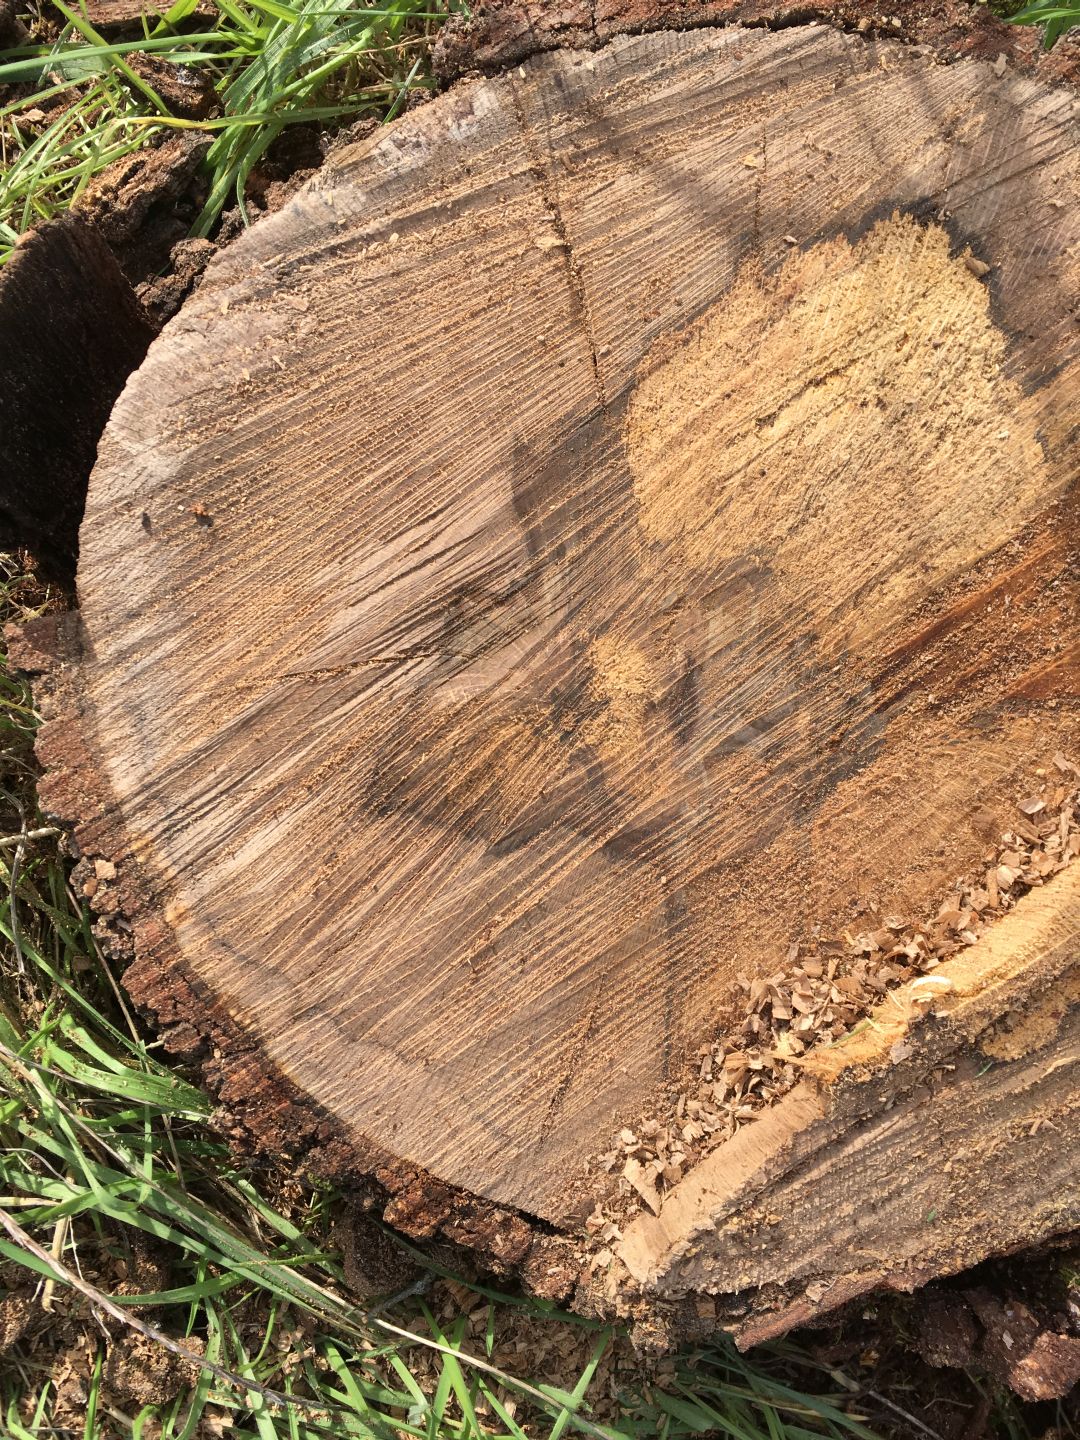
20170117TZ_StumpRings.jpg ( 2017-01-17 13:10:28 ) Full size: 1080x1440
Trunk cross-section from a dead tree Rob cut down near the tower guy wire on the southwest corner
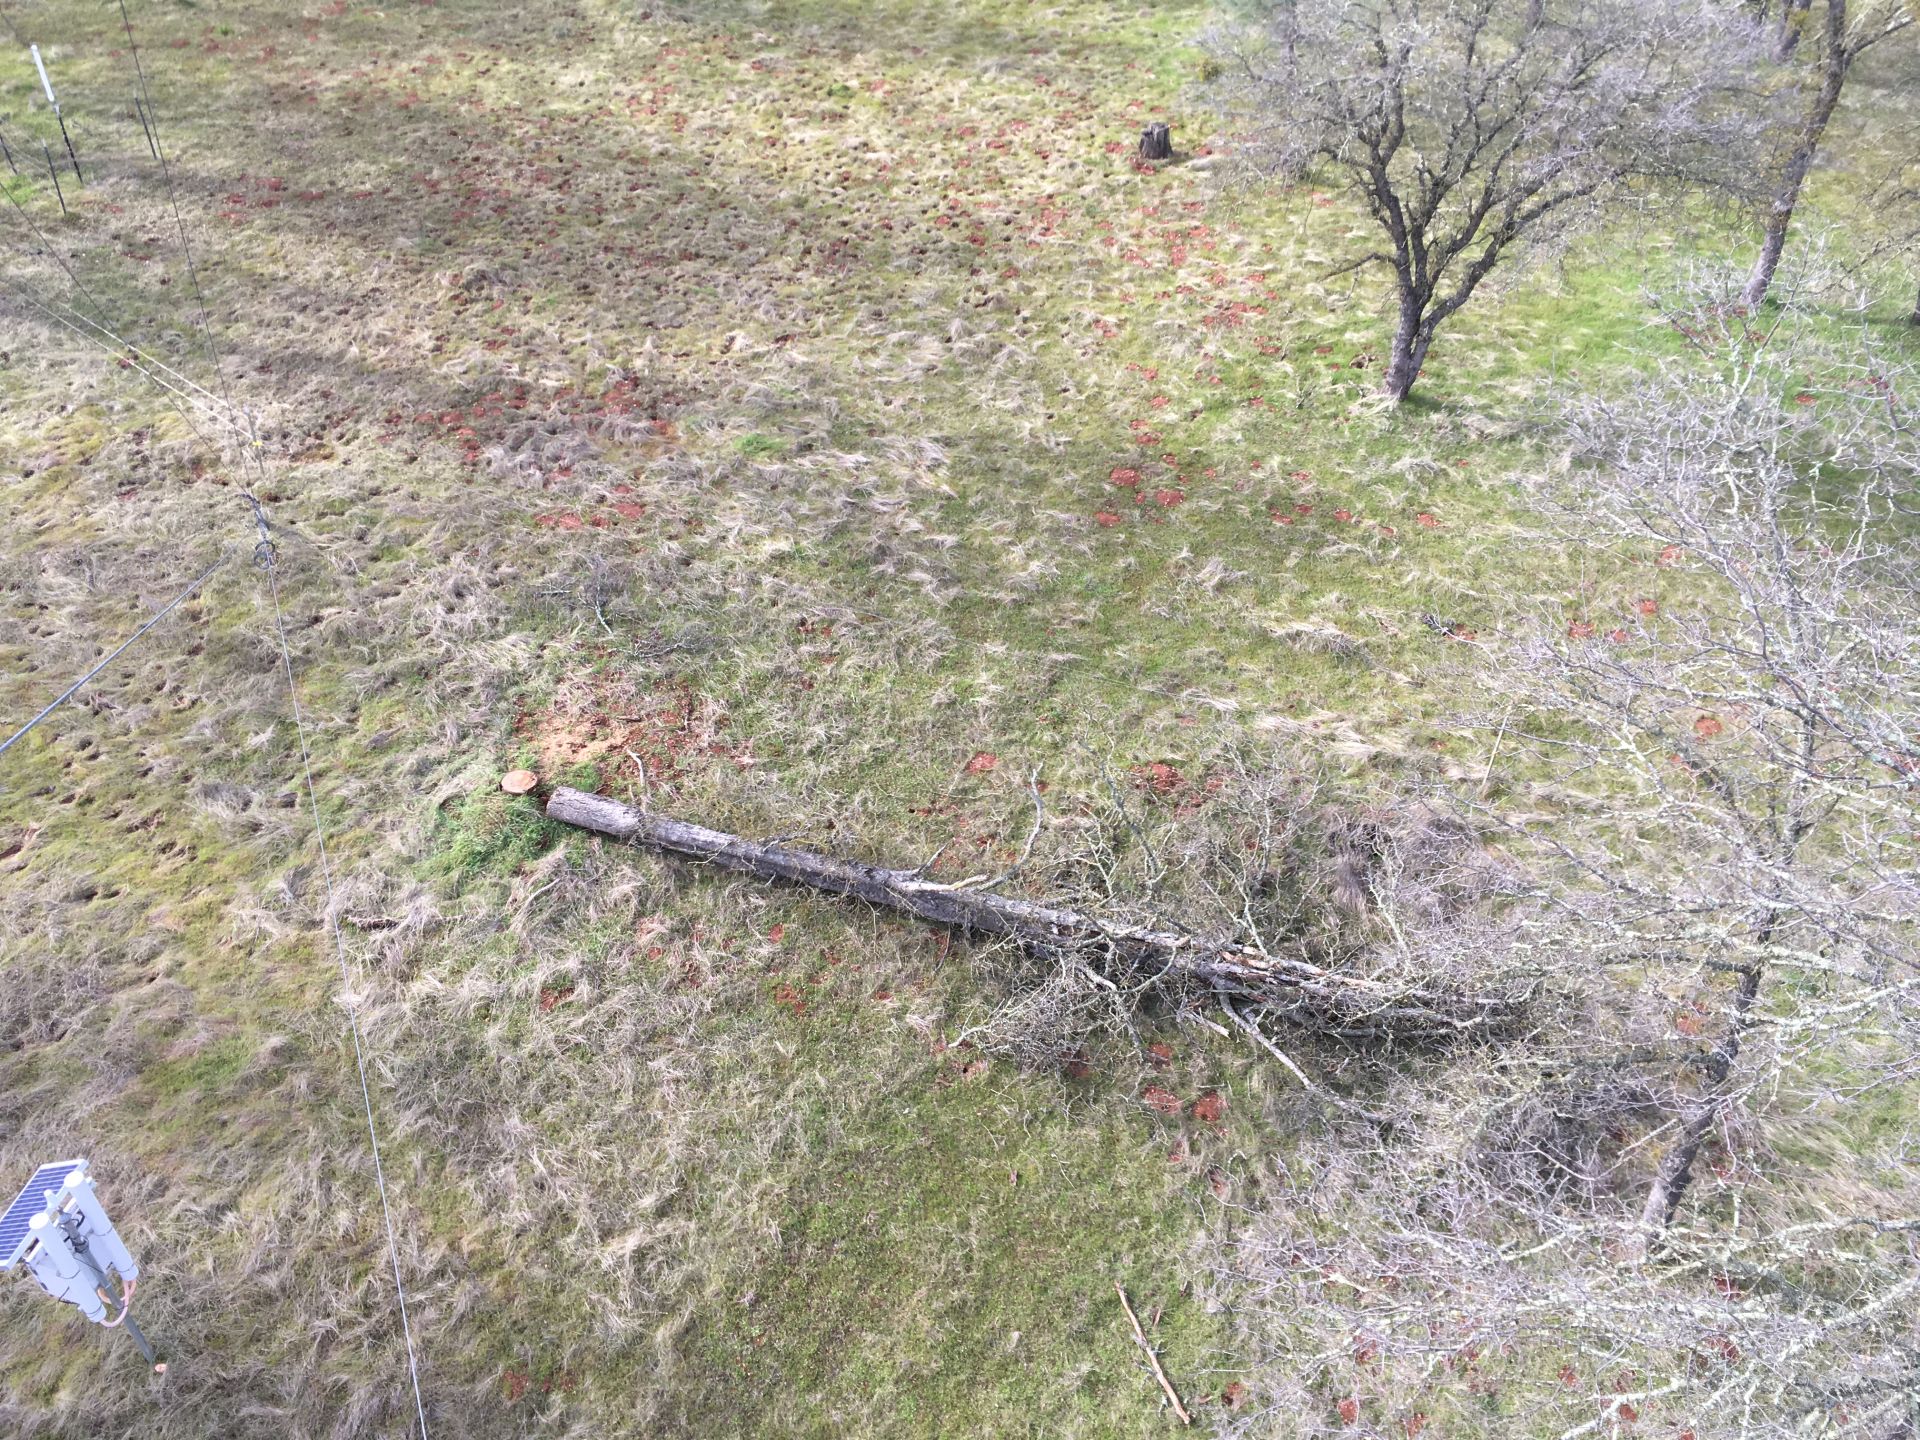
20170117TZ_CutTree.jpg ( 2017-01-17 12:39:41 ) Full size: 1920x1440
Rob cut down a dead tree near the tower guy wire on the southwest corner
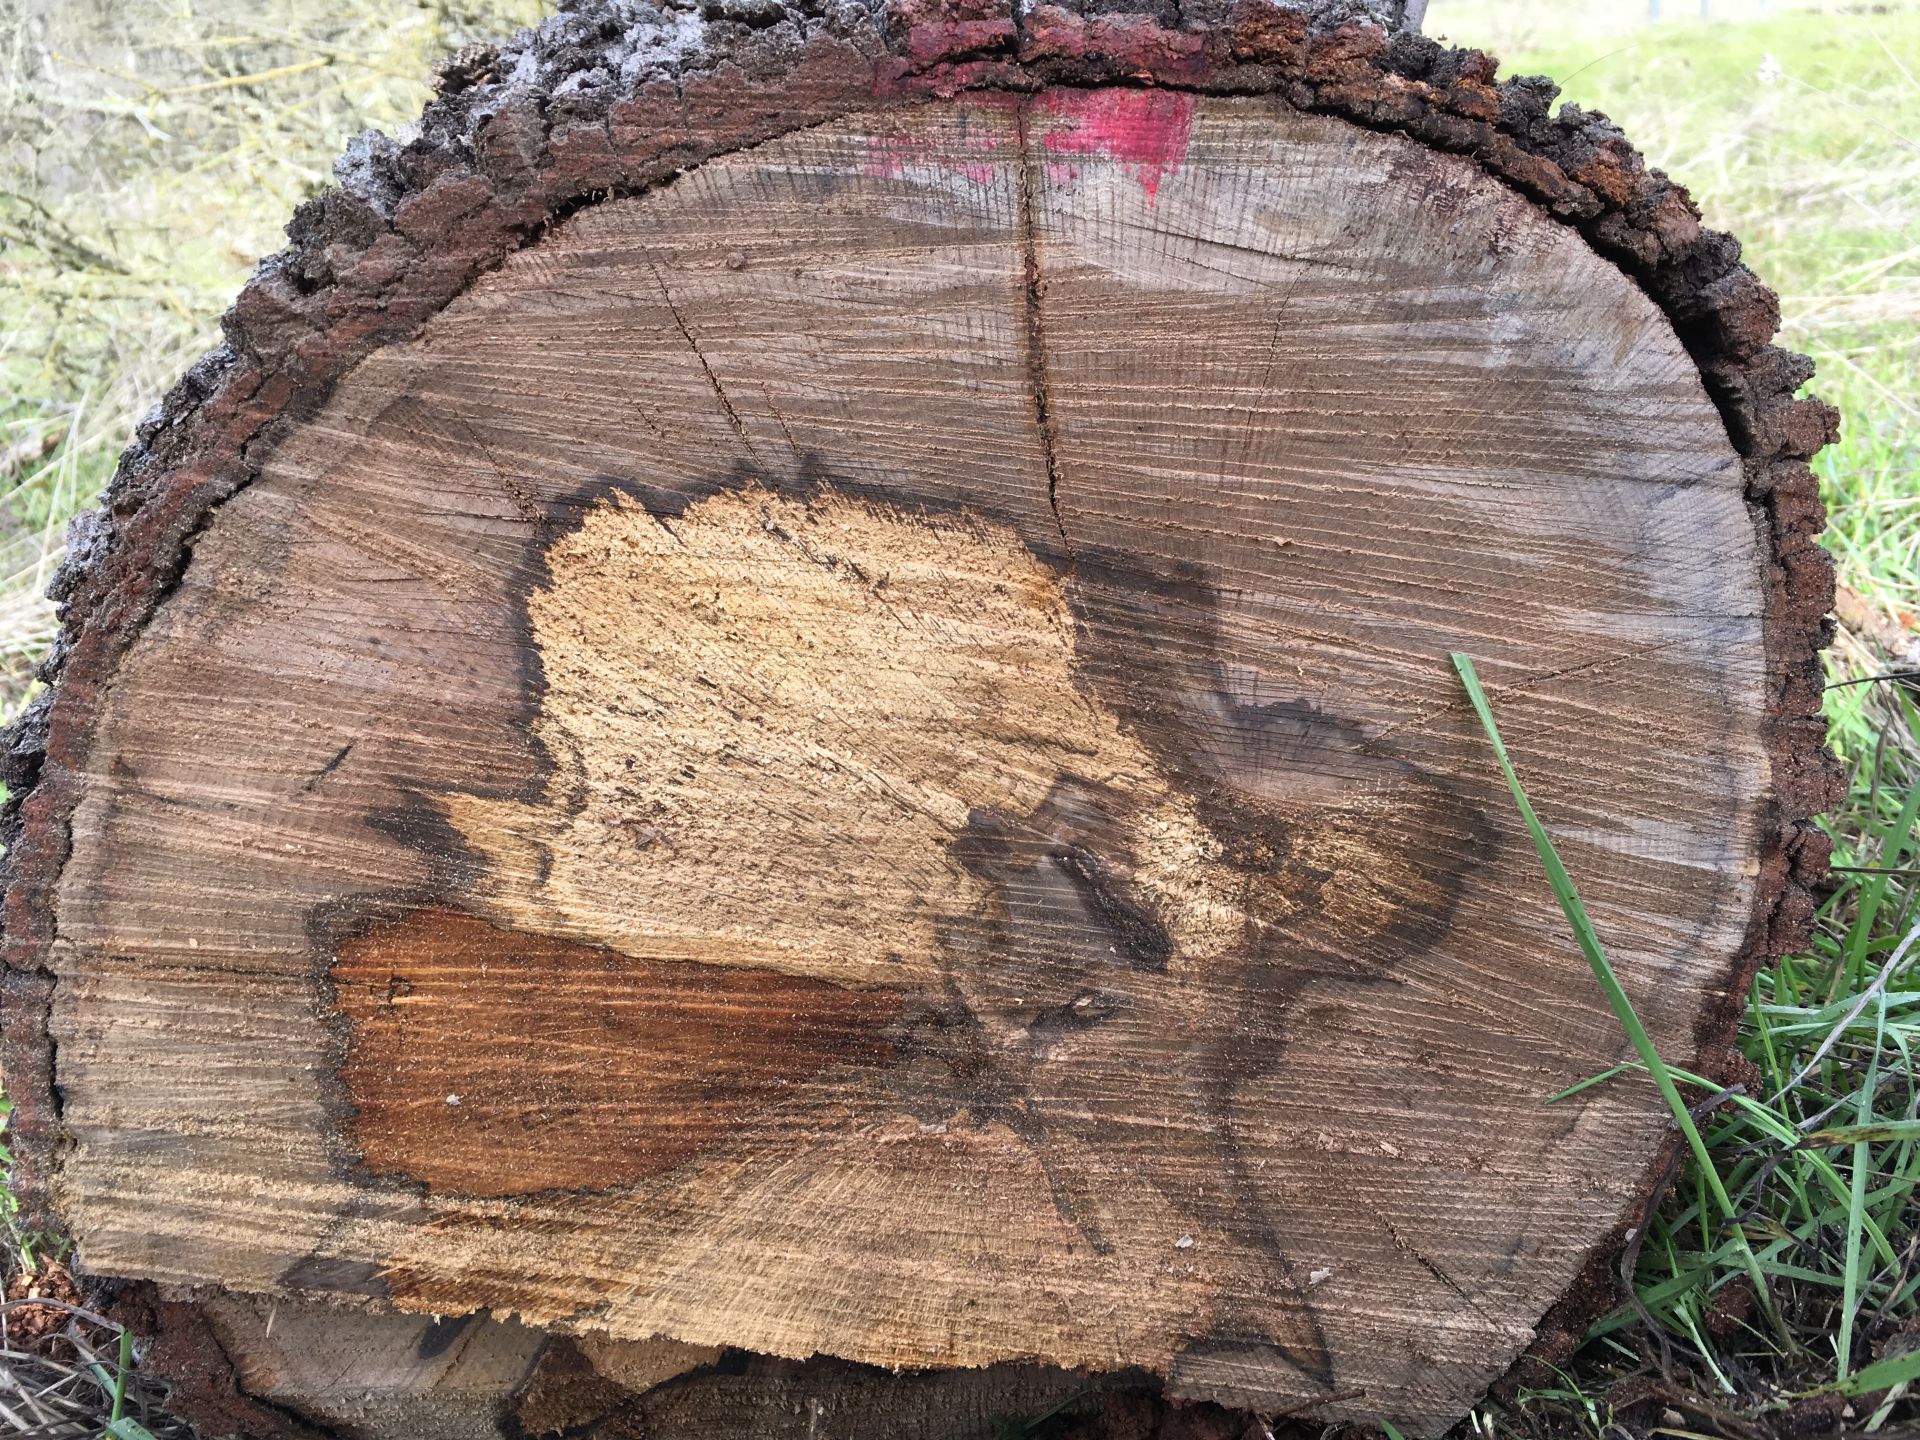
20170117TZ_TrunkRings.jpg ( 2017-01-17 13:10:56 ) Full size: 1920x1440
Trunk cross-section from a dead tree Rob cut down near the tower guy wire on the southwest corner
16 sets found
No data found for TZ_Fenergy.
11 TZ_tmet graphs found
11 TZ_soilco2 graphs found
Can't check TZ_mixed
3 TZ_mixed graphs found
1 TZ_fflux graphs found
8 TZ_fmet graphs found
No data found for TZ_tram.
No data found for TZ_co2prof.
1 TZ_irt graphs found
No data found for TZ_windprof.
1 TZ_tflux graphs found
2 TZ_sm graphs found
Can't check TZ_met
1 TZ_met graphs found
Can't check TZVR_mixed
No data found for TZ_osu.
No data found for TZ_fd.
Tonzi Z-cam data