
Field Notes
<--2017-01-06 11:00:00 | 2017-01-17 11:30:00-->Other sites visited today: Mayberry | Sherman Wetland | Bouldin Alfalfa | East End | West Pond | Twitchell Alfalfa | Twitchell Rice | Vaira | Tonzi
Phenocam link: Searching...
Tonzi: 2017-01-17 10:30:00 (DOY 17)
Author: Siyan Ma
Others: Joe. Miriam Johnston
Summary: Very wet, fixed Tower power, swapped Floor 7500, Standard field work, cut down dead tree by tower guy wires.
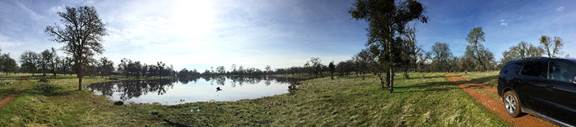
When: Date: 1/17/2017 , Day: 17 , Watch Time: 10:30 am . Where: Tonzi/Vaira Ranch Who: Siyan, Joe, Miriam Weather: cloudy Phenology: Tonzi pond looked full, almost to the level of the winter of Year 2005.
Summary
Vaira_Grass Site
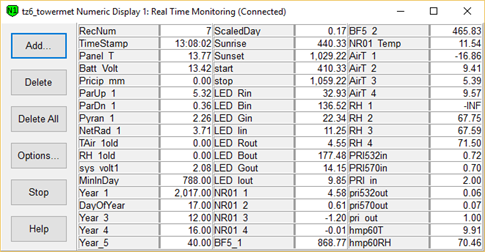
Tonzi_Tower Site
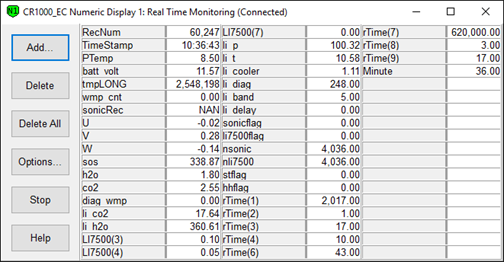
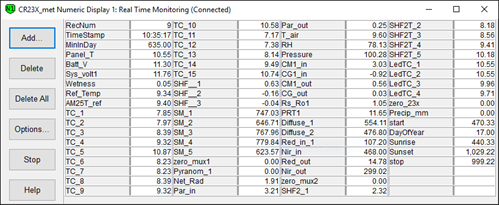
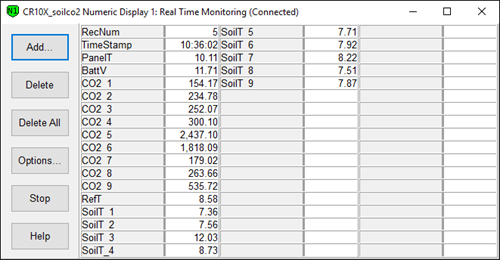
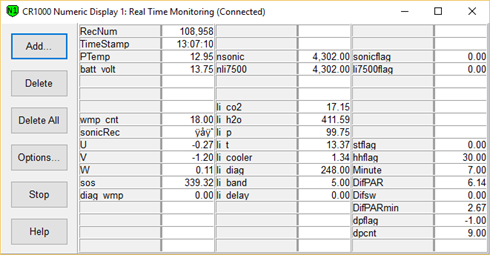
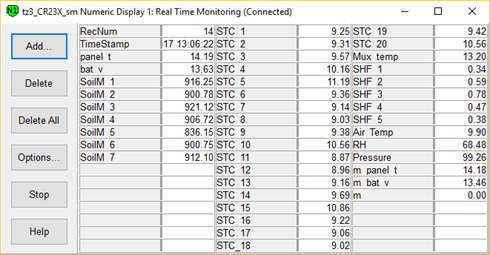
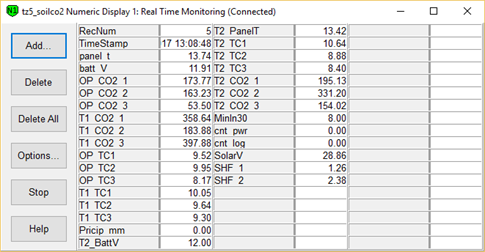
6. Screens of met dataloggers: CR23X3 – floor-Met; CR23X6 – tower-Met; CR10X2 – floor-Met; Soil CO2 profile: CR23X5 – soil CO2 profile
8. closed gate and set up fence. YES! Toniz_Floor Site
|
Field Data
No tank data
Well Depth
| Date | Location | Depth (feet) |
|---|---|---|
| 2017-01-17 | TZ_floor | 23.9 |
| 2017-01-17 | TZ_road | 31.1 |
| 2017-01-17 | TZ_tower | 27 |
mode = both
Moisture Point Probes TZ
Array
(
[0] => Tower_1
[1] => Floor_South_1
[2] => Floor_West_1
[3] => SoilCO2_1
[4] => Soil_Transect_4_1
[5] => Soil_Transect_3_1
[6] => Soil_Transect_2_1
[7] => Soil_Transect_1_1
[8] => SoilCO2_West_A_1
[9] => SoilCO2_West_B_1
[10] => SoilCO2_West_C_1
[11] => Tower_2
[12] => Floor_South_2
[13] => Floor_West_2
[14] => SoilCO2_2
[15] => Soil_Transect_4_2
[16] => Soil_Transect_3_2
[17] => Soil_Transect_2_2
[18] => Soil_Transect_1_2
[19] => SoilCO2_West_A_2
[20] => SoilCO2_West_B_2
[21] => SoilCO2_West_C_2
[22] => Tower_3
[23] => Floor_South_3
[24] => Floor_West_3
[25] => SoilCO2_3
[26] => Soil_Transect_4_3
[27] => Soil_Transect_3_3
[28] => Soil_Transect_2_3
[29] => Soil_Transect_1_3
[30] => SoilCO2_West_A_3
[31] => SoilCO2_West_B_3
[32] => SoilCO2_West_C_3
[33] => Tower_4
[34] => Floor_South_4
[35] => Floor_West_4
[36] => SoilCO2_4
[37] => Soil_Transect_4_4
[38] => Soil_Transect_3_4
[39] => Soil_Transect_2_4
[40] => Soil_Transect_1_4
[41] => SoilCO2_West_A_4
[42] => SoilCO2_West_B_4
[43] => SoilCO2_West_C_4
)
| Date | DOY | Rep | Depth | Tower_1 |
Floor_South_1 |
Floor_West_1 |
SoilCO2_1 |
Soil_Transect_4_1 |
Soil_Transect_3_1 |
Soil_Transect_2_1 |
Soil_Transect_1_1 |
SoilCO2_West_A_1 |
SoilCO2_West_B_1 |
SoilCO2_West_C_1 |
Tower_2 |
Floor_South_2 |
Floor_West_2 |
SoilCO2_2 |
Soil_Transect_4_2 |
Soil_Transect_3_2 |
Soil_Transect_2_2 |
Soil_Transect_1_2 |
SoilCO2_West_A_2 |
SoilCO2_West_B_2 |
SoilCO2_West_C_2 |
Tower_3 |
Floor_South_3 |
Floor_West_3 |
SoilCO2_3 |
Soil_Transect_4_3 |
Soil_Transect_3_3 |
Soil_Transect_2_3 |
Soil_Transect_1_3 |
SoilCO2_West_A_3 |
SoilCO2_West_B_3 |
SoilCO2_West_C_3 |
Tower_4 |
Floor_South_4 |
Floor_West_4 |
SoilCO2_4 |
Soil_Transect_4_4 |
Soil_Transect_3_4 |
Soil_Transect_2_4 |
Soil_Transect_1_4 |
SoilCO2_West_A_4 |
SoilCO2_West_B_4 |
SoilCO2_West_C_4 |
Avg | Spacial Count |
Measurement Count |
|---|---|---|---|---|---|---|---|---|---|---|---|---|---|---|---|---|---|---|---|---|---|---|---|---|---|---|---|---|---|---|---|---|---|---|---|---|---|---|---|---|---|---|---|---|---|---|---|---|---|---|
| 2017-01-17 | 17 | 0 | nan | 36.7 | 32.9 | 37.9 | 38.4 | 32.6 | 22.3 | 29.1 | 33.8 | 33.8 | 32 | 35.5 | 44.8 | 43.9 | 39.6 | 39.9 | 39.9 | 34.1 | 33 | 28.6 | 32.9 | 30.4 | 34.4 | 38.8 | 42.7 | 41.9 | 46 | 38.8 | 35.4 | 36.8 | 37.4 | 36.6 | 39.6 | 37.4 | 39.5 | 57.2 | 45.4 | 41.7 | 35.7 | 45.4 | 47.1 | 39.4 | 45.4 | 50 | 49.1 | |||
| 2017-01-17 | 17 | 1 | nan | 37 | 37.6 | 32.3 | 23.8 | 28.2 | 34.1 | 33.8 | 44.8 | 39.9 | 39.1 | 33.8 | 33.2 | 28.3 | 33.2 | 39.4 | 41.3 | 39.1 | 34.9 | 36 | 36.8 | 36.8 | 38.8 | 44.8 | 35.7 | 44.8 | 48.6 | 39.1 | 44.3 | |||||||||||||||||||
| 2017-01-17 | 17 | Avg | 0-15cm | 0 | 0 | |||||||||||||||||||||||||||||||||||||||||||||
| 2017-01-17 | 17 | Avg | 15-30cm | 0 | 0 | |||||||||||||||||||||||||||||||||||||||||||||
| 2017-01-17 | 17 | Avg | 30-45cm | 0 | 0 | |||||||||||||||||||||||||||||||||||||||||||||
| 2017-01-17 | 17 | Avg | 45-60cm | 0 | 0 |
mode = both
Moisture Point Probes VR
Array
(
[0] => Solar_Panels_1
[1] => Flux_Tower_1
[2] => Gate_1
[3] => Biomass_Cage_1
[4] => Flux_Tower_2
[5] => Gate_2
[6] => Biomass_Cage_2
[7] => Solar_Panels_3
[8] => Flux_Tower_3
[9] => Gate_3
[10] => Biomass_Cage_3
[11] => Solar_Panels_4
[12] => Flux_Tower_4
[13] => Gate_4
[14] => Biomass_Cage_4
[15] => Solar_Panels_2
)
| Date | DOY | Rep | Depth | Solar_Panels_1 |
Flux_Tower_1 |
Gate_1 |
Biomass_Cage_1 |
Flux_Tower_2 |
Gate_2 |
Biomass_Cage_2 |
Solar_Panels_3 |
Flux_Tower_3 |
Gate_3 |
Biomass_Cage_3 |
Solar_Panels_4 |
Flux_Tower_4 |
Gate_4 |
Biomass_Cage_4 |
Solar_Panels_2 |
Avg | Spacial Count |
Measurement Count |
|---|---|---|---|---|---|---|---|---|---|---|---|---|---|---|---|---|---|---|---|---|---|---|
| 2017-01-17 | 17 | 0 | nan | 34.1 | 18.5 | 37.9 | 12.7 | 69.2 | 21.3 | 25.8 | 31.6 | 26.8 | 26.2 | 32.9 | 43.8 | 26.2 | 23.1 | 33.1 | ||||
| 2017-01-17 | 17 | 1 | nan | 33.8 | 28.2 | 37.3 | 13 | 31.6 | 21.9 | 24.6 | 31.8 | 27.4 | 26.9 | 32.9 | 42.5 | 24.8 | 23.4 | 33.1 | 31 | |||
| 2017-01-17 | 17 | Avg | 0-15cm | 0 | 0 | |||||||||||||||||
| 2017-01-17 | 17 | Avg | 15-30cm | 0 | 0 | |||||||||||||||||
| 2017-01-17 | 17 | Avg | 30-45cm | 0 | 0 | |||||||||||||||||
| 2017-01-17 | 17 | Avg | 45-60cm | 0 | 0 |
No TZ grass heigth found
No VR grass heigth found
Tree DBH
| Date | Tag# | Reading (mm) |
|---|---|---|
| 2017-01-17 | 1 | 25.5 |
| 2017-01-17 | 102 | 23.0 |
| 2017-01-17 | 2 | 19.8 |
| 2017-01-17 | 245 | 23.2 |
| 2017-01-17 | 3 | 23.9 |
| 2017-01-17 | 4 | 20.0 |
| 2017-01-17 | 5 | 21.0 |
| 2017-01-17 | 7 | 17.5 |
| 2017-01-17 | 72 | 23.5 |
| 2017-01-17 | 79 | 23.3 |
| 2017-01-17 | 8 | 20.8 |
No water potential data found
No TZ Grass Biomass data found
No TZ OakLeaves Biomass data found
No TZ PineNeedles Biomass data found
3 photos found
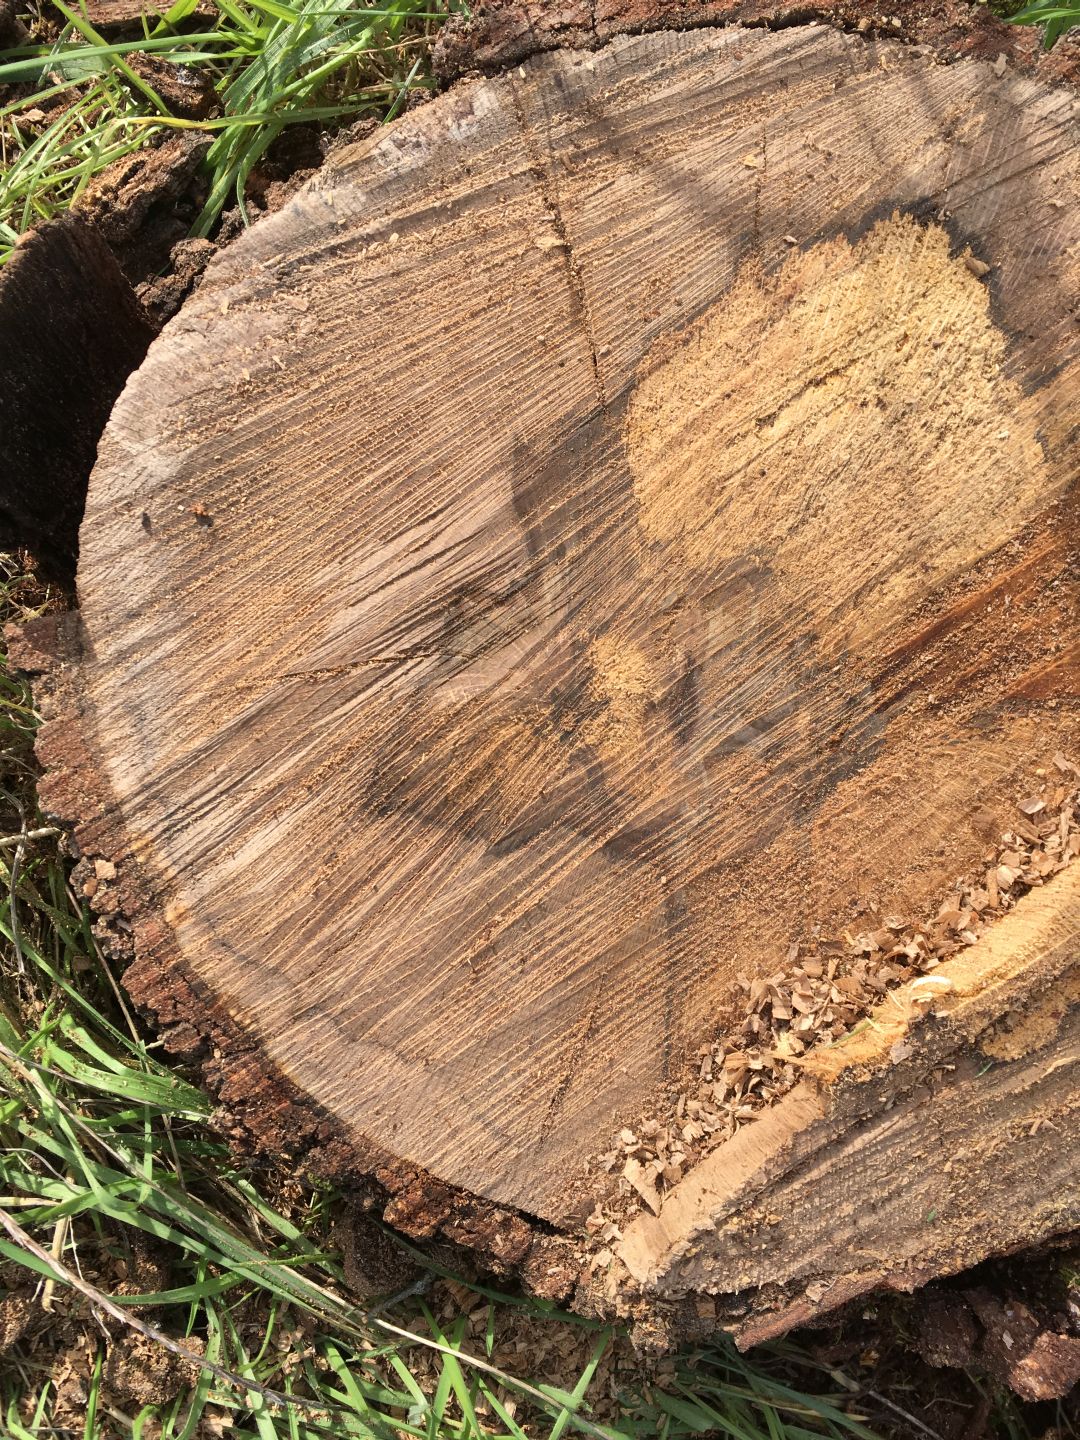
20170117TZ_StumpRings.jpg ( 2017-01-17 13:10:28 ) Full size: 1080x1440
Trunk cross-section from a dead tree Rob cut down near the tower guy wire on the southwest corner
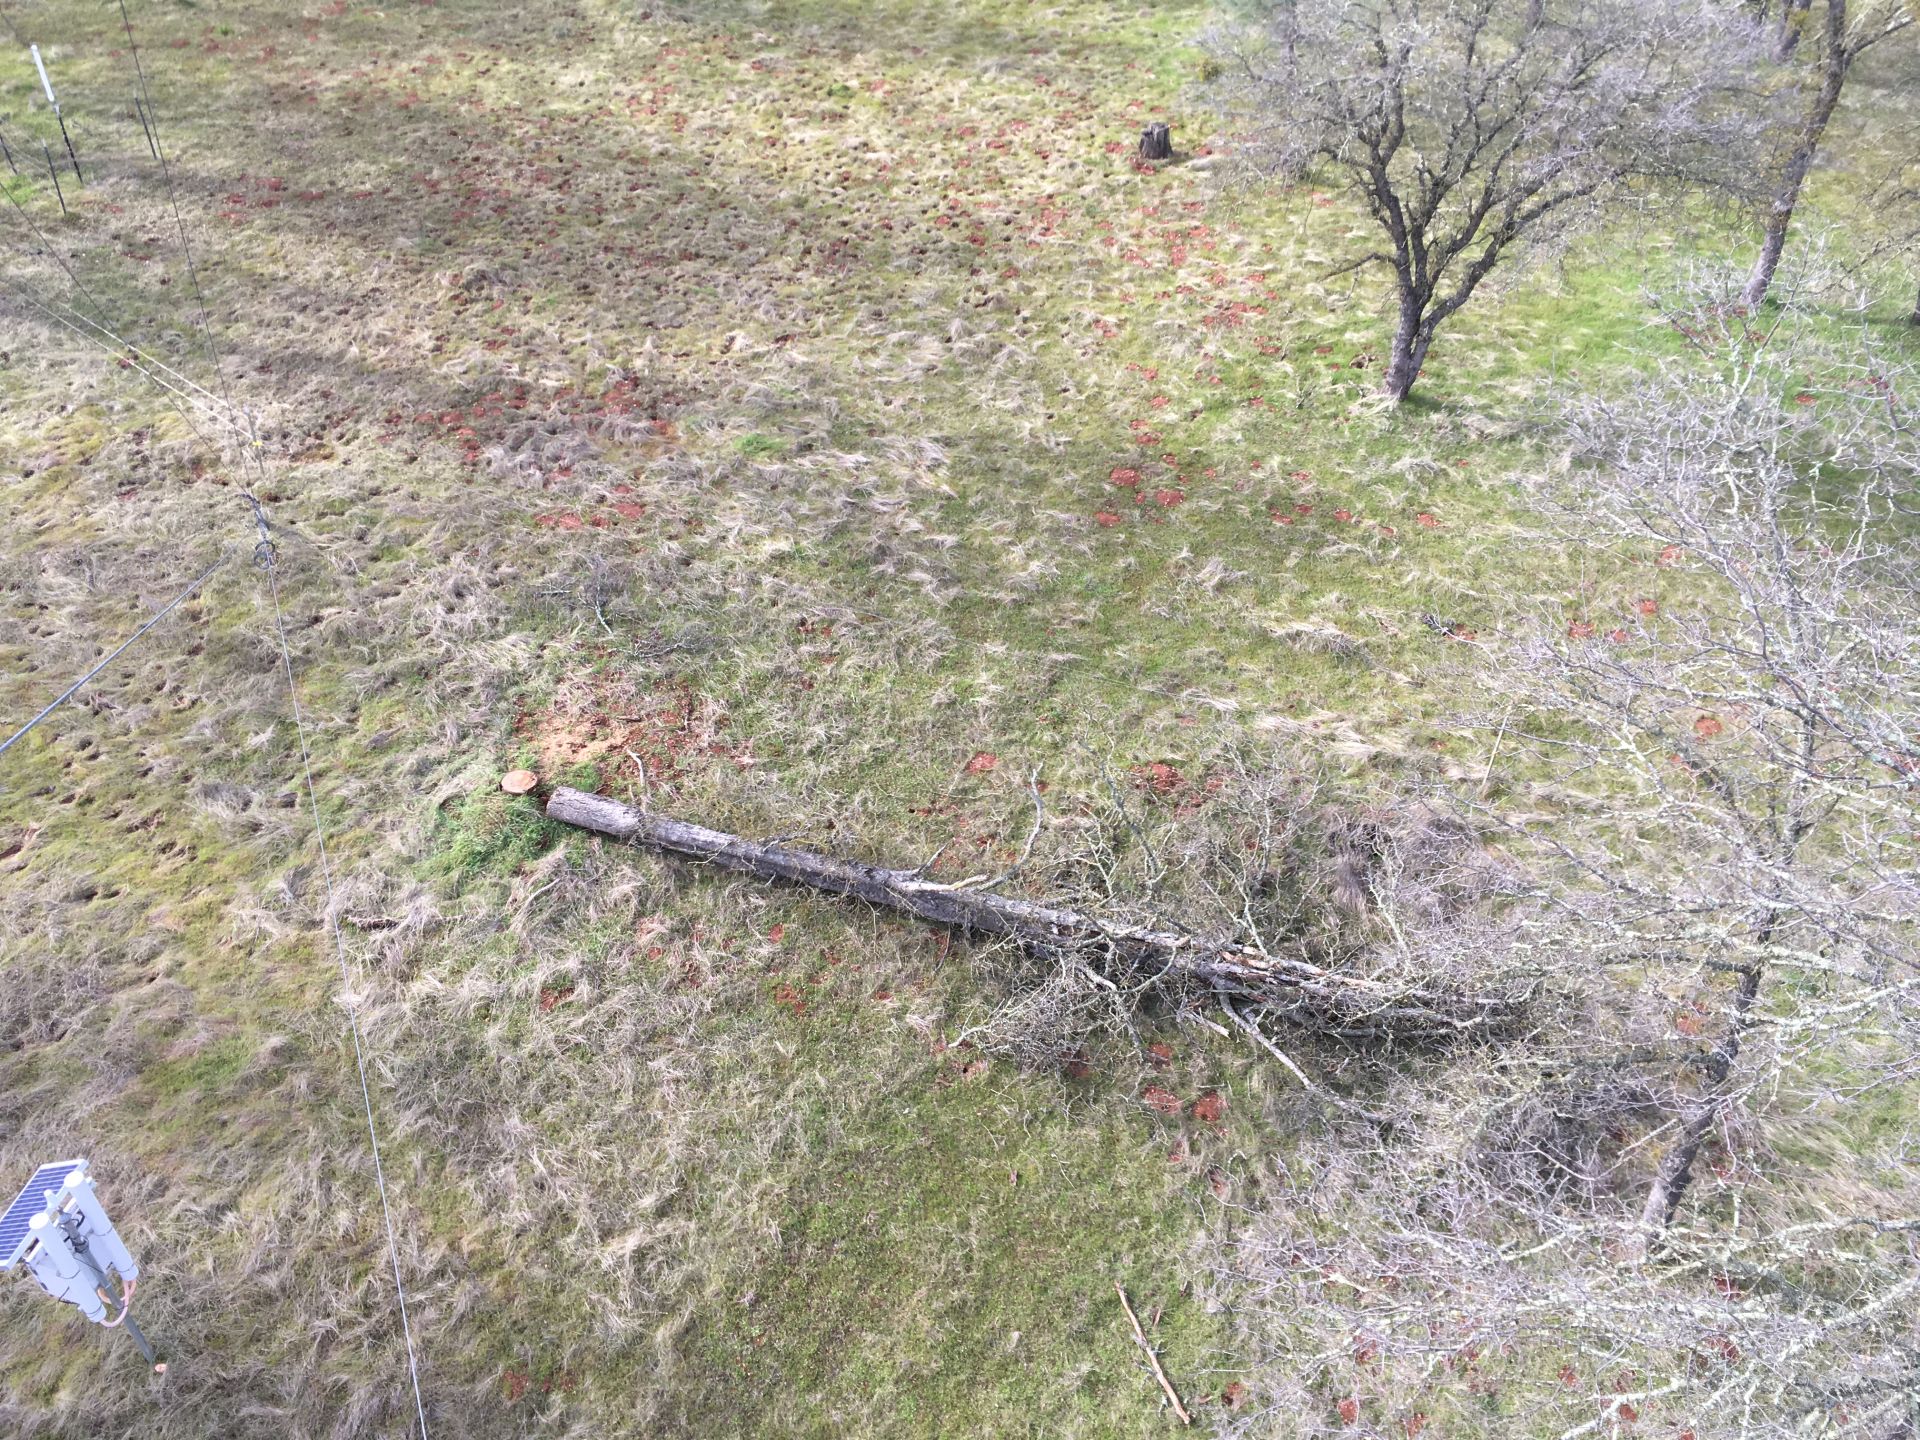
20170117TZ_CutTree.jpg ( 2017-01-17 12:39:41 ) Full size: 1920x1440
Rob cut down a dead tree near the tower guy wire on the southwest corner
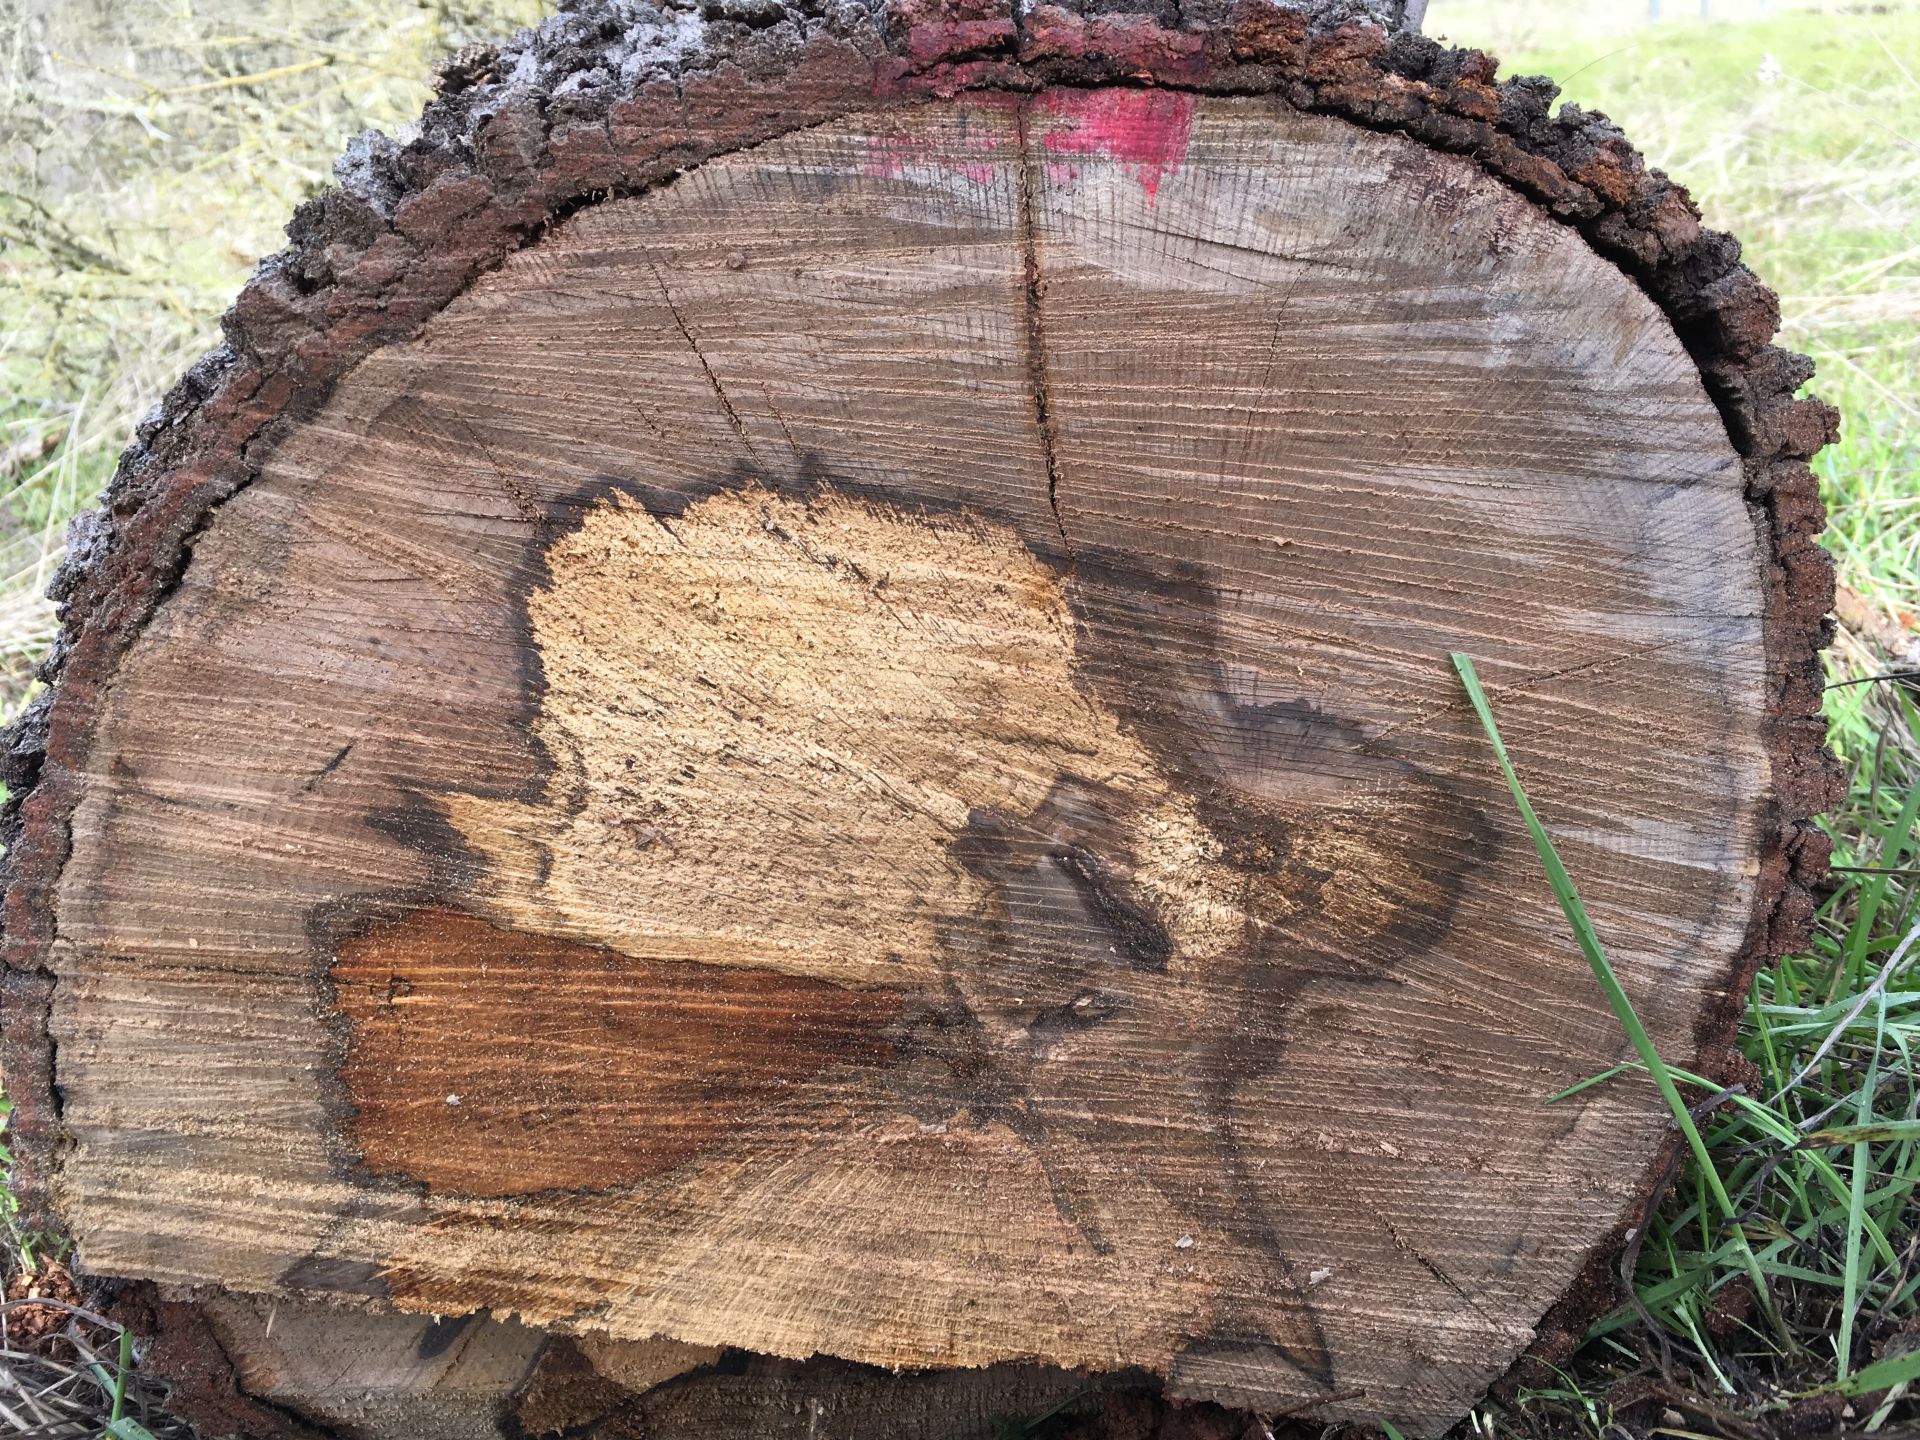
20170117TZ_TrunkRings.jpg ( 2017-01-17 13:10:56 ) Full size: 1920x1440
Trunk cross-section from a dead tree Rob cut down near the tower guy wire on the southwest corner
16 sets found
No data found for TZ_Fenergy.
11 TZ_tmet graphs found
11 TZ_soilco2 graphs found
Can't check TZ_mixed
3 TZ_mixed graphs found
1 TZ_fflux graphs found
8 TZ_fmet graphs found
No data found for TZ_tram.
No data found for TZ_co2prof.
1 TZ_irt graphs found
No data found for TZ_windprof.
1 TZ_tflux graphs found
2 TZ_sm graphs found
Can't check TZ_met
1 TZ_met graphs found
Can't check TZVR_mixed
No data found for TZ_osu.
No data found for TZ_fd.
Tonzi Z-cam data