Field Notes
<--2016-10-26 09:10:00 | 2016-11-11 13:30:00-->Other sites visited today: East End | Twitchell Rice | Twitchell Alfalfa | West Pond
Phenocam link: Searching...
Sherman Wetland: 2016-11-08 14:00:00 (DOY 313)
Author: Elke Eichelmann
Others: Kyle Hemmes, Dennis Baldocchi, Joe Verfaillie, Tyler Anthony, Heather Dang
Summary: Regular data collection, soil sampling in tower footprint, replaced broken TC rod
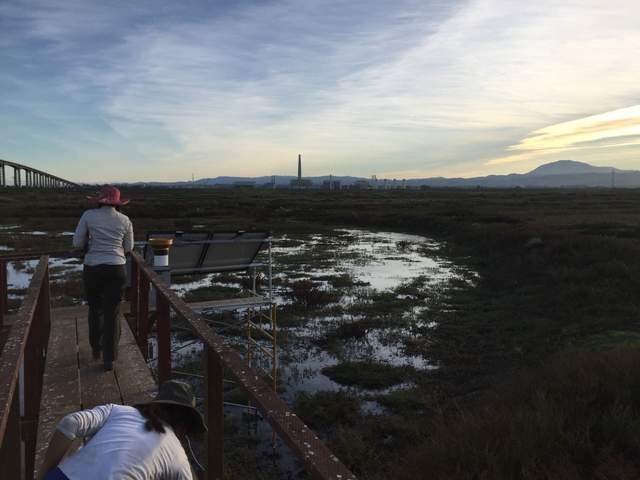
| Arrived at 14:00. It was sunny, warm and mostly clear with some thin clouds high above and a light breeze. We met Brian in the wetland, he said they had started to flood the wetland about two weeks ago and the water table is slowly coming up. We could see some standing water in the channels and pools around the tower, but most of the east end of the wetland around the tower was still fairly dry. We met with Tyler and Heather from Whendee Silver’s lab to collect soil samples for bulk density, and soil chemistry (C, N, Fe). Soil samples for chemistry analysis were collected along three parallel transects, each 5m apart, with 5 sampling points, also each 5m apart. Samples were collected within the footprint of the eddy flux tower, starting approximately 25m west of the tower base and moving westwards from there towards the channel west of the tower. At each sampling point three soil samples were collected, one each from 0-15cm, 15-30cm, and 30-60cm. There was one pit dug to the west of the tower, slightly north-east of the soil chemistry transects, for bulk density samples. One set of bulk density samples was collected in 5cm (not sure about this number) increments from the top down to 60cm depth. We collected USB GHG data and collected met data. All looked good. Swapped CF camera card. Replaced one of the thermocouple rods for water set A which was mowed down a little while ago. The top two thermocouples had been ripped off the rod when it was mowed down, but were not damaged. We taped the thermocouples back at the right locations (30cm and 50cm above ground level). After replacing the rod we put the TC profile back at the same location as it was before. We cleaned the radiation and eddy flux sensors. Refilled the wash reservoir, it was almost empty. The LI7700 top mirror had quite a few smudges on it. The water table pressure sensor was sitting in some wet mud. We cleaned out the well and the well tube and replaced everything. It seems like the water table is just around the bottom of the well. The WT sensor sits at 130cm from the top of the well and the top of the well was 50cm above ground level after we had replaced it. LI7500 readings: CO2 408.7 umol/mol H2O 658 mmol/m3 T 24.57 Celsius P 100.8 kPa SS 97.0 -> 100 after cleaning LI7700 readings: CH4: 2.0 RSSI: 16 -> 80 after cleaning Left at 16:30 |
1 photos found

20161108SW_Flooding.jpg ( 2016-11-08 16:07:39 ) Full size: 1920x1440
Bryan said they had started to flood the wetland about two weeks ago and the water table is slowly coming up. We could see some standing water in the channels and pools around the tower.
7 sets found
Can't check MBWPEESWGT_mixed
Can't check MBEEWPSWEPGT_cam
15 SW_met graphs found
4 SW_flux graphs found
Can't check MBSWEEWPBCBA
Can't check SW_Temp
14 SW_Temp graphs found
No data found for SW_arable.

