Field Notes

<--2016-11-08 14:00:00 | 2016-11-22 09:15:00-->
Other sites visited today: Mayberry
Phenocam link: Searching...

Sherman Wetland: 2016-11-11 13:30:00 (DOY 316)
Author: Elke Eichelmann
Others: Patty Oikawa, 3 Students from CSU East Bay

Summary: Soil Sampling for C and N analysis

Arrived at 13:30. It was cloudy and foggy. The water table was quite a bit higher than at our last visit three days ago. Most of the ponds and channels around the tower have filled in with water and are probably knee to hip deep.

We collected some more soil samples for soil chemistry (C, N). Soil samples for chemistry analysis were collected along three parallel transects, each 5m apart, with 6 sampling points, also each 5m apart. Samples were collected within the footprint of the eddy flux tower or slightly to the North of it, starting approximately 50m west and 40m north of the tower base and moving southwards from there towards the first soil sampling location.
At each sampling point three soil samples were collected, one each from 0-15cm, 15-30cm, and 30-60cm.
Left at 15:45

1 photos found

Location of soils sampled for carbon and nitrogen analysis
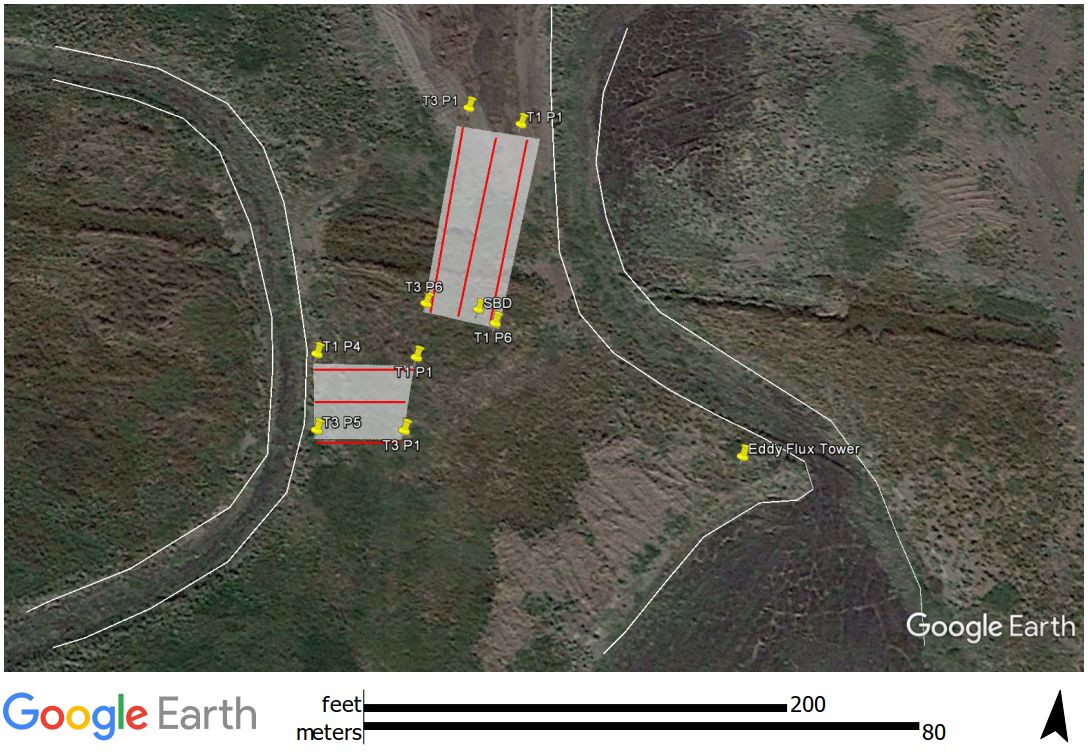
20161111SW_SoilSampleMap.jpg ( 2016-11-11 00:00:00 ) Full size: 1088x755
Location of soils sampled for carbon and nitrogen analysis

Graphs display:
7 sets found

Can't check MBWPEESWGT_mixed
Can't check MBEEWPSWEPGT_cam
15 SW_met graphs found

Explore the graph:Temperatures in a new window

Explore the graph:Water Temperature Profile A in a new window

Explore the graph:Water Temperature Profile B in a new window

Explore the graph:Soil Temperature Profile C2 in a new window

Explore the graph:Soil Heat Flux in a new window

Explore the graph:Four channel Radiometer in a new window

Explore the graph:Sherman Wetland PAR in a new window

Explore the graph:PRI Channels in a new window

Explore the graph:NDVI Channels in a new window

Explore the graph:Water level and Rain in a new window

Explore the graph:Dissolved CO2 in a new window

Explore the graph:Air Pressure in a new window

Explore the graph:Battery Voltage and RH in a new window

Explore the graph:Soil Temperature Profile C1 in a new window

Explore the graph:SRS NDVI and PRI in a new window

4 SW_flux graphs found

Explore the graph:CO2 and H2O in a new window

Explore the graph:Wind in a new window

Explore the graph:Methane in a new window

Explore the graph:Data Counts in a new window

Can't check MBSWEEWPBCBA
Can't check SW_Temp
14 SW_Temp graphs found

Explore the graph:Temperatures in a new window

Explore the graph:CO2 and H2O in a new window

Explore the graph:Wind in a new window

Explore the graph:Methane in a new window

Explore the graph:Data Counts in a new window

Explore the graph:Temperature Profile A in a new window

Explore the graph:Temperature Profile B in a new window

Explore the graph:Temperature Profile C in a new window

Explore the graph:Soil Heat Flux in a new window

Explore the graph:Four-channel radiometer in a new window

Explore the graph:NDVI Channels in a new window

Explore the graph:PAR in a new window

Explore the graph:Air Pressure and Water Level in a new window

Explore the graph:Air T and RH in a new window

No data found for SW_arable.