
Field Notes
<--2016-10-11 10:10:00 | 2016-11-11 11:35:00-->Other sites visited today: Sherman Wetland | Twitchell Rice | East End | West Pond | Twitchell Alfalfa
Phenocam link: Searching...
Mayberry: 2016-10-26 09:50:00 (DOY 300)
Author: Elke Eichelmann
Others: Joe Verfaillie, Sam Chamberlain
Summary: Regular data collection, redeployed water FR CO2 sensor, water level low
| Arrived at 9:50. It was sunny and mostly clear with only a few fluffy clouds on the horizon. There was some hunting going on in the wetland while we were there. We heard shots fired not too far away. The wetland vegetation was very brown and mostly dead, the water level was really low with lots of exposed mud around where the vegetation grows. The water was also really brown. Refilled wash reservoir. There were lots of wasps in the reservoir box. Collected USB GHG data, collected met data from CR23X. Tul1_Ts16 still –INF. Had no problems connecting to datalogger, but only collected last 300 records at first since the settings were changed last time in the field when there were problems with the connection. Did a ‘Collect ALL data’ collection after that which collected everything since sometime in 2015. When Joe fumbled around with the wires in the datalogger box to reconnect the FR CO2 probe the datalogger restarted itself. There seems to be a weak power connection somewhere. Redeployed 0-2% FRCO2_A probe sn 20150111 at original middle level which is now just below surface b/c of low water table. Tried to remove the bubble traps south of the tower from Whendee Silver’s lab since they are not used at this point. Could not get them completely disconnected from the fence posts etc, so left them on the side of the pond for now. Swapped LI7500 for calibration, sn 75H-2669 came down from the tower, sn 75H-2176 went up on the tower. LI7500 readings: Old LI7500 sn 2669 -> new LI7500 sn 2176 CO2 406.59 -> 411.90 umol/mol H2O 695.4 -> 642.42 mmol/m3 T 19.62 -> 19.82 Celsius P 101.79 -> 101.99 kPa SS 100.11 -> 89.57 LI7700 readings: CH4: 1.92 RSSI: 24 -> 76 after cleaning Left at 10:45 |
1 photos found
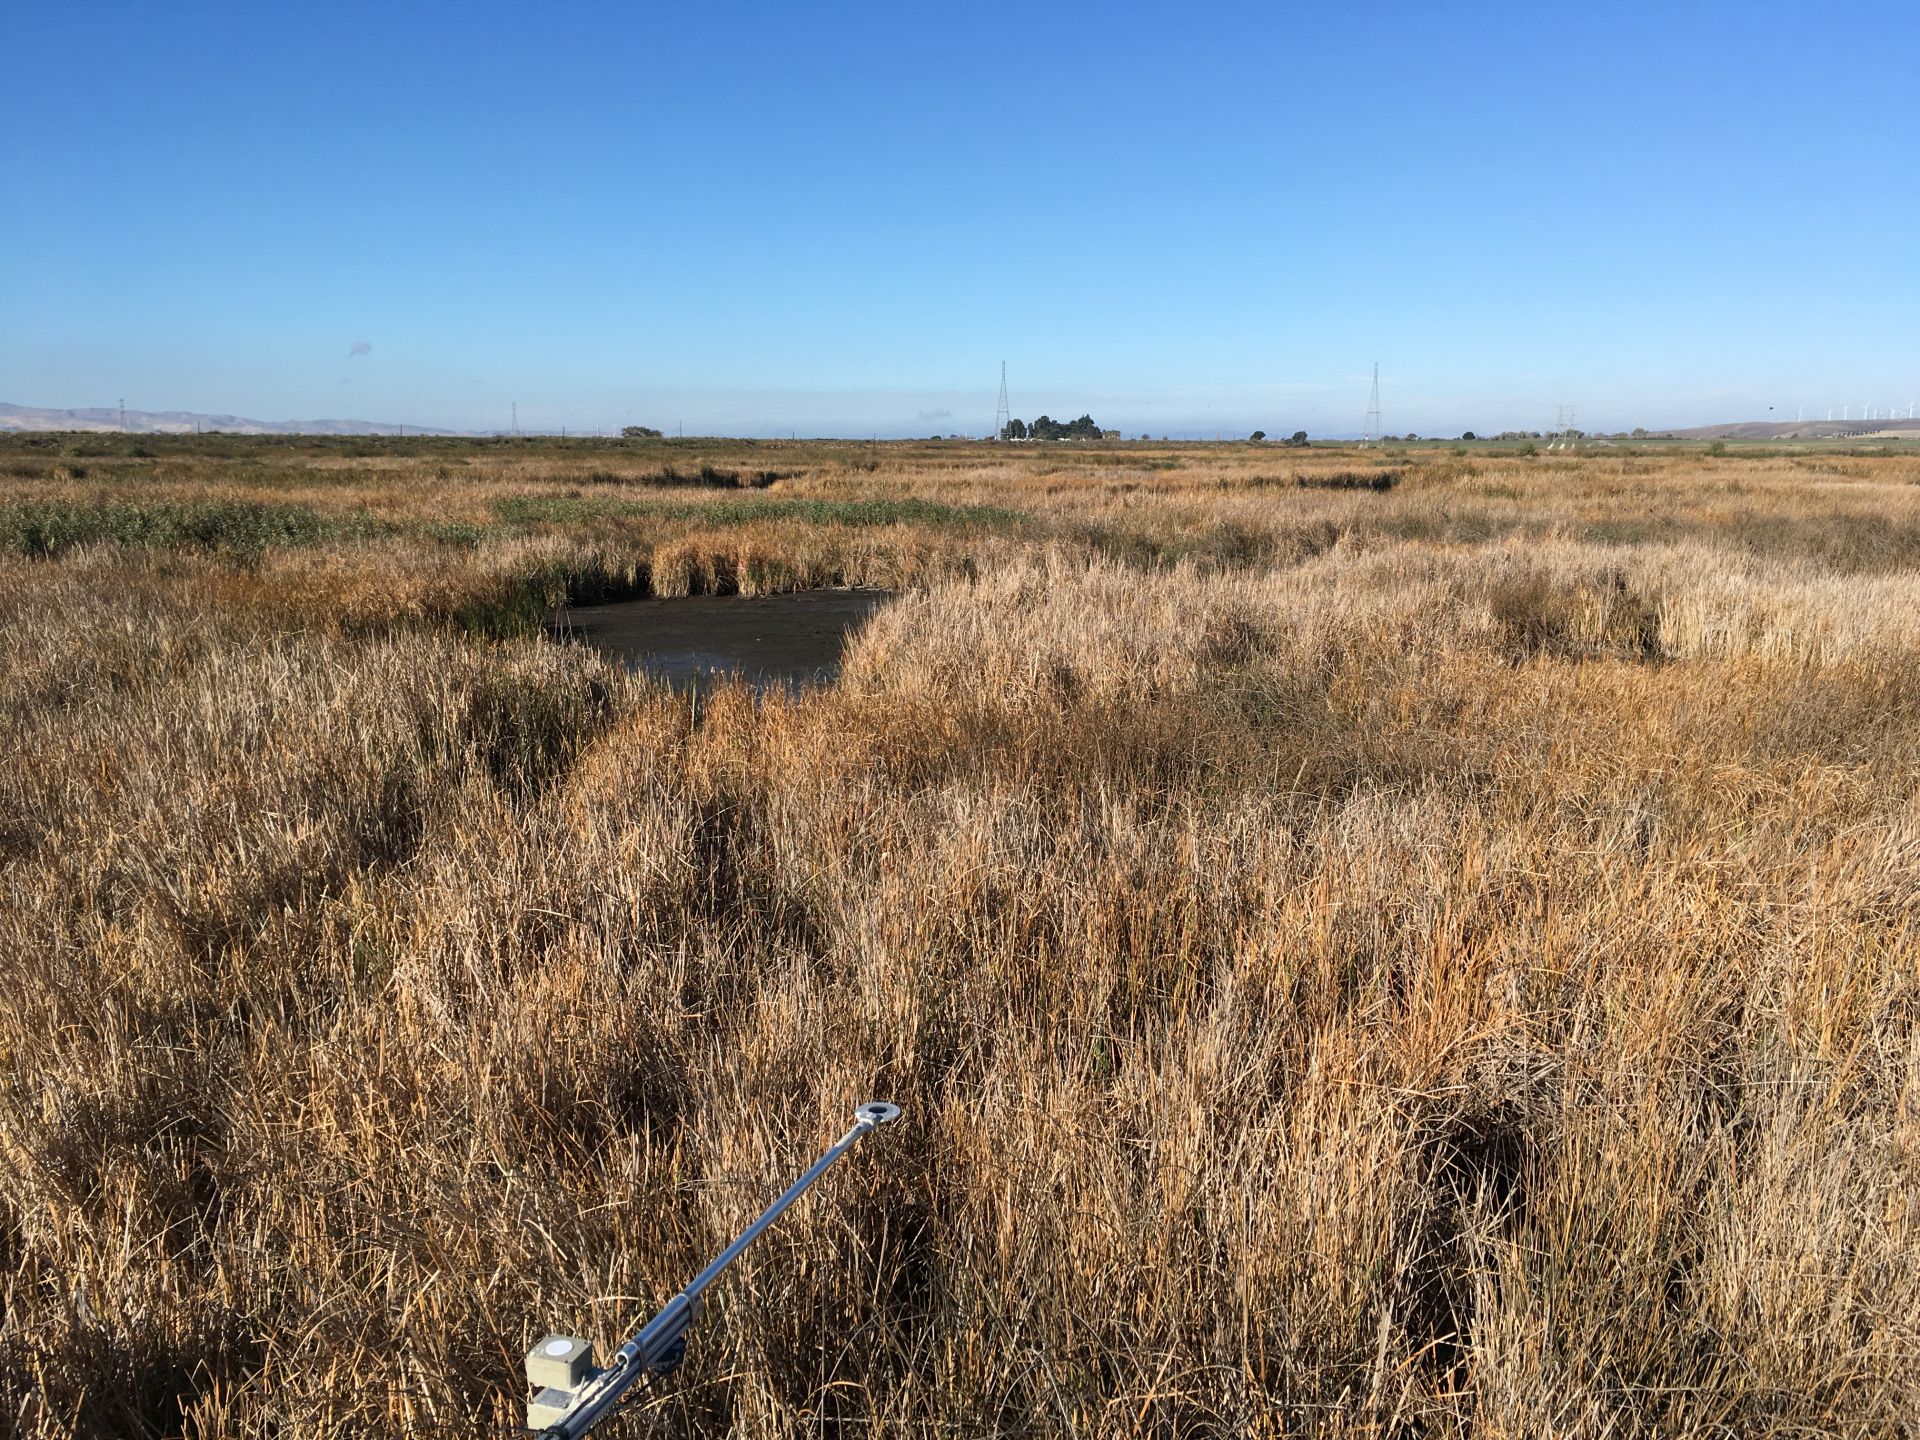
20161207MB_BareGRound.jpg ( 2016-10-26 10:18:10 ) Full size: 1920x1440
Net radiometer over brown wetland reeds
11 sets found
7 MB_flux graphs found
No data found for MB_met.
28 MB_tule graphs found
Can't check MBWPEESWGT_mixed
1 MB_cam graphs found
Can't check MBEEWPSWEPGT_cam
Can't check SIMBTWEE_met
1 MB_minidot graphs found
Can't check MBSWEEWPBCBA
1 MB_processed graphs found
Can't check MB_fd
1 MB_fd graphs found