Field Notes
<--2016-10-11 14:05:00 | 2016-11-08 11:00:00-->Other sites visited today: Sherman Wetland | Twitchell Rice | Mayberry | East End | West Pond
Phenocam link: Searching...
Twitchell Alfalfa: 2016-10-26 13:20:00 (DOY 300)
Author: Elke Eichelmann
Others: Joe Verfaillie, Sam Chamberlain
Summary: Moved tower over to soil sensor location, power to soil sensors was cut during field work, regular data collection
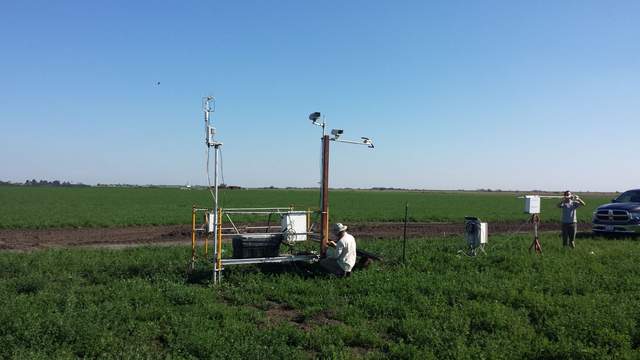
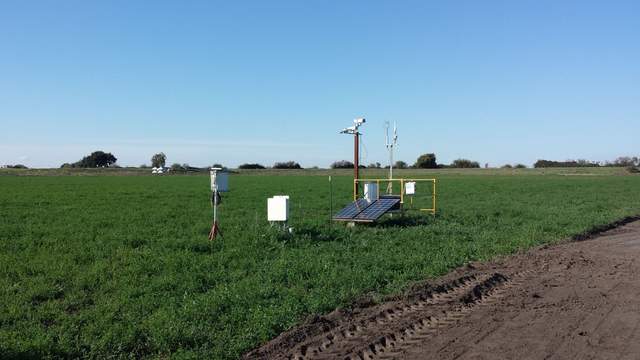
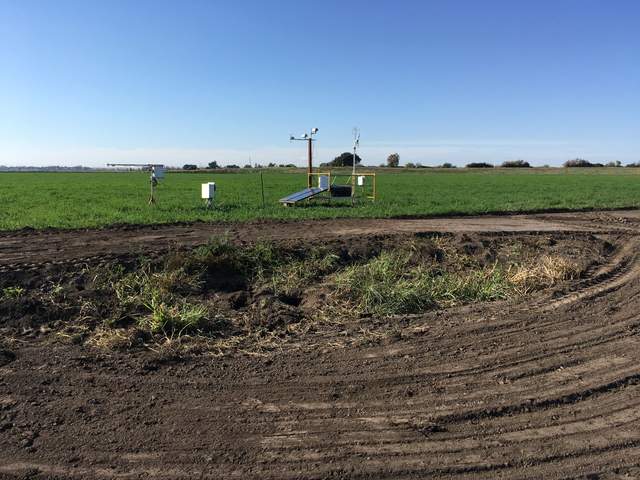
| Arrived at 13:20. It was sunny and clear with no wind. Some more work had been done filling in and disking the ditch around our tower. During that our power cable to the soil sensors was cut and the one to the diffuse PAR sensor. We decided to move the tower over to the soil sensors since it was now in a little dip on its own and it looked like they were planning to do more work around there. We moved the tower and solar panels just to the north of the soil sensors. Everything was covered in spider webs around there and lots of spiders came falling down when the tower was moved. The new sonic boom angle heading is 355 degree from true north. The new height of the instruments is 3.23m from ground to middle of sonic path. After the tower was moved and power was restored to everything, we collected USB GHG data and collected met data. All looks good. The Met and soilCO2 data showed data all the way up to 13:00 on Oct 26, so it seems like the power was cut just before we got there. However, the radiation data only had a few days of data right at the start and now data since then. Not sure what has been going on there Swapped CF camera card. Collected 5 biomass samples and veg height: Veg height in cm: 29, 16, 17, 30, 23, 24, 42, 36, 33, 29, 21, 42, 26, 23, 31, 28, 33, 22, 21, 12 I tried to do soil respiration but it took a long time to draw down and it never went down enough to stop. The first time it went only down to 402ppm. I checked all connections, one of the O-rings is broken, maybe that’s it? After retightening all connections and fixing some of the foam insulation at the bottom of the chamber I tried to run the drawdown again. This time it went down to 382ppm, but still not low enough to cycle through the program. Left it at that. Need to check what’s going on with this in the lab. Sam took spectral readings. LI7500 readings: CO2 406.86 umol/mol H2O 706.8 mmol/m3 T 26.02 Celsius P 101.28 kPa SS 83.8 -> 86.37 after cleaning Left at 15:07 |
Veg Height (cm): Tape measure from ground to top of plant
29, 16, 17, 30, 23, 24, 42, 36, 33, 29, 21, 42, 26, 23, 31, 28, 33, 22, 21, 12, avg = 26.9, stdev = 8.02
3 photos found

20161026TA_NewTowerLoc1.jpg ( 2016-10-26 14:20:58 ) Full size: 1920x1080
We moved the tower and solar panels in the alfalfa field to just to the north of the soil sensors.

20161026TA_NewTowerLoc2.jpg ( 2016-10-26 14:57:04 ) Full size: 1920x1080
We moved the tower and solar panels in the alfalfa field to just to the north of the soil sensors.

20161026TA_TowerMoved.jpg ( 2016-10-26 14:58:24 ) Full size: 1920x1440
We moved the tower and solar panels in the alfalfa field to just to the north of the soil sensors
7 sets found
Can't check TA_met
11 TA_met graphs found
Can't check TA_rad
3 TA_rad graphs found
Can't check TA_flux
5 TA_flux graphs found
Can't check TA_soilco2
7 TA_soilco2 graphs found
No data found for TA_arable.
1 TA_cam graphs found
Can't check TATWBABCSB_cam

