
Field Notes
<--2016-05-24 10:30:00 | 2016-06-24 12:00:00-->Other sites visited today: Sherman Wetland | Mayberry | East End | West Pond | Twitchell Alfalfa
Phenocam link: Searching...
Twitchell Rice: 2016-06-06 12:25:00 (DOY 158)
Author: Alison Haddad
Others: Elke Eichelmann, Kyle Hemes, Joe Verfaillie
Summary: Moved tower back into field, reinstalled thermocouples and SHF plates, normal data collection.
| Arrived at 12:25. Sunny, quite warm, clear sky with a few thin clouds on the horizon. Rice field still was not flooded, and rice is about 15 cm tall. Some weeds have begun to take root. Non-rice vegetation looks a little dry. Moved tower back into field by temporarily attaching two long poles to lift it with. LI770 was taken down to move the tower and cleaned while down. Therefore, we have no ‘before cleaning’ measurement for rssi. Tower was staked into place and all SHF plates and thermocouples were reinstalled. The LI770 was reinstalled 312 cm above ground, and all functions were tested and found working. The spray head leaked a little by the zip tie. The well was also reinstalled and the top of the pipe is now 20.8 cm above ground. Water level is 144 cm from the top of the pipe, about 123 cm below ground. The sonic boom angle was adjusted to 344 degrees from magnetic north Methane wash water reservoir filled, was nearly full. Collected USB GHG data, collected met data from 23X, collected camera pictures. TS 4 cm (profile 2) was dead and is now repaired. Top inch of rightmost temp profile snapped, braced temporarily. Replace with stronger red profile sticks Took 5 biomass samples using a 400cm2 plot. Sample no; canopy height (cm); fresh weight (g); LAI (cm2) 1; 15; 1.60; 95.368 2; 16; 0.58; 30.739 3; 16; 1.19; 61.802 4; 16; 0.86; 41.728 5; 15; 0.78; 38.943 Took canopy height measurements in cm: 15, 14, 15, 13, 19, 16, 15, 15 ,13, 16, 22, 13,16, 17, 22, 13, 15, 19 ,16, 19. LI7500 data CO2 412.62 H2O 640.6 T 29.84 P 101.08 ss 78.53 LI7700 data CH4 1.90 rssi 71.2 left at 13:30 |
Veg Height (cm): Tape measure from ground to top of plant
15, 14, 15, 13, 19, 16, 15, 15, 13, 16, 22, 13, 16, 17, 22, 13, 15, 19, 16, 19, avg = 16.2, stdev = 2.76
1 photos found
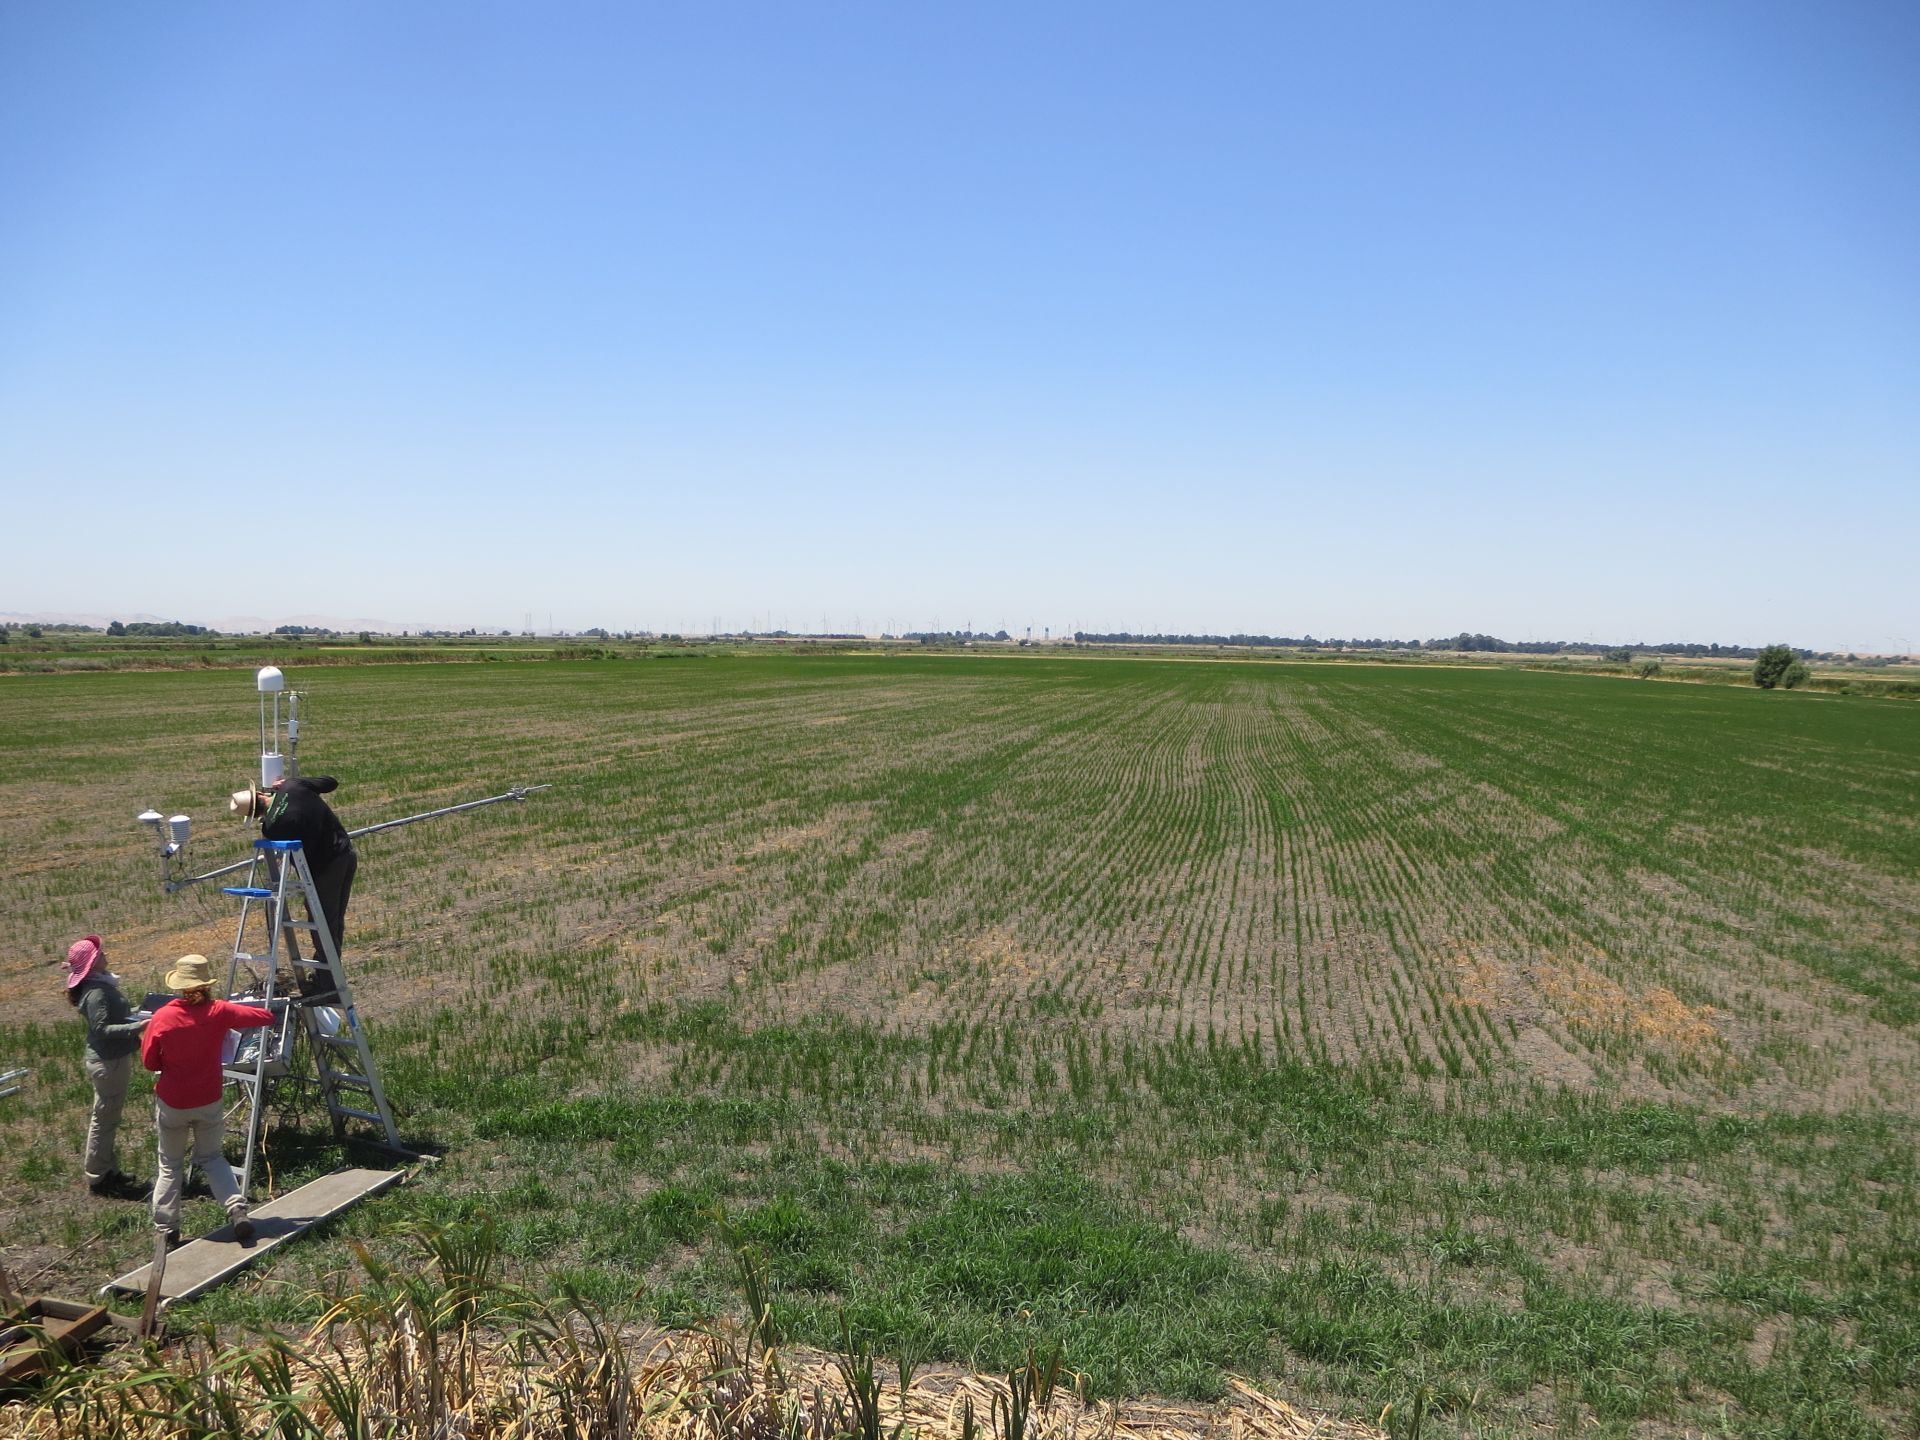
TW_autocam_20160606_1145.jpg ( 2016-06-06 11:45:01 ) Full size: 1920x1440
Moving tower back into the field
6 sets found
12 TW_met graphs found
5 TW_flux graphs found
Can't check TWSI_mixed
Can't check SIMBTWEE_met
1 TW_cam graphs found
Can't check TATWBABCSB_cam