Field Notes

<--2008-07-02 09:00:00 | 2008-07-23 09:00:00-->
Phenocam link: Searching...

Sherman Island: 2008-07-15 15:00:00 (DOY 197)
Author: Dennis Baldocchi
Others: Siyan

Summary: Soil to hard for inserting Tsoil and found that parallel winds may be bringing methane to flux tower.

Sherman Island - Methane Study

Date

July 15 2008

DOY

Standard Time in

1500

Time out

1600

Who: ddb, Siyan

Weather: clear, mild and windy from the Bay

Phenology: Pepperweed in full bloom.

Check list

Fance and gate

ok

Gill sonics

w

0.10

T

24.1

u

6.51

H20

3.8

v

5.9

CO2

1.13

CH4

1.81

Methane Sensor (type Scroll Scroll 1)

Hi-flow ppm

ok

Cell Pressure – near 159

140

We either need to reset

Mirror time

16.3

Was 18 last time but there have been lots of fires. Its holding ok

Sample rate

10

Low flow. put back in high flow !

Pump hours

1628

Filter Status

Water traps

clean

Air conditioning

70F

Its too cool so I changed the flow from hi to low..lets watch it

Datalogger

Batt volt

12.1

fans of air temp/RH sensors

ok

Radiometric sensors

ok

Water Table depth (inches)


If Swapping Li-7500 Analyzer

Remove SN#

Install SN#

Additional Tasks

Water table depths off fence (inches)

South

North

Vegetation height – 20 samples (inches)

Other Notes:

Tair 24.3, rh 60, water pressure 0.31

Have fixed the Tsoil in the lab, but soil is real hard to insert.

Walt is irrigating the fields next to Mayberry slough. Winds are slightly parallel but I think they may be running across these fields too and bringing some methane to the flux tower. We need to look at recent wind roses. There was some methane structure to the signals.

1 photos found

People in the field
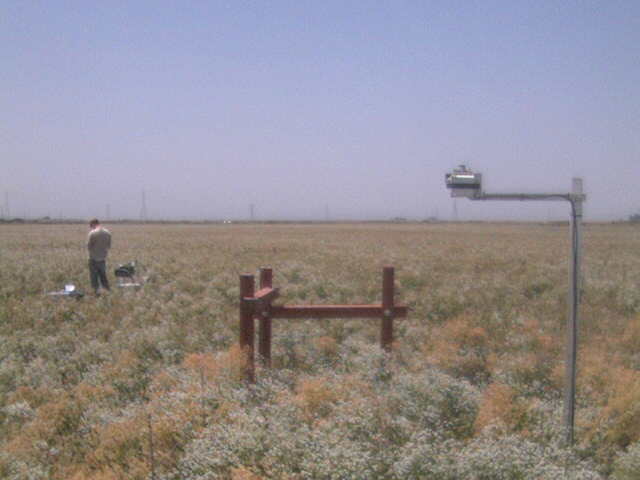
SI_webcam_2008196_1237.jpg ( 2008-07-14 11:37:04 ) Full size: 640x480
People in the field

Graphs display:
7 sets found

No data found for SI_mp.
10 SI_met graphs found

Explore the graph:Solar Radiation in a new window

Explore the graph:Energy in a new window

Explore the graph:Soil Temperatures Set 1 in a new window

Explore the graph:Soil Temperatures Set 2 in a new window

Explore the graph:Soil Temperatures Set 3 in a new window

Explore the graph:Soil Temperature at -16cm in a new window

Explore the graph:Solar Radiation from CNR1 in a new window

Explore the graph:Sherman Island Rain in a new window

Explore the graph:Sherman Well Level in a new window

Explore the graph:Box Temperatures in a new window

Can't check SI_mixed
2 SI_mixed graphs found

Explore the graph:Theta Probes in a new window

Explore the graph:Sherman Island Air Temperatures in a new window

4 SI_flx graphs found

Explore the graph:Sonic Wind in a new window

Explore the graph:CH4 Concentrations in a new window

Explore the graph:Sample Counts in a new window

Explore the graph:LI7500 CO2 and H2O in a new window

No data found for SI_soilco2.
Can't check TWSI_mixed
Can't check SIMBTWEE_met